Predicting Kickstarter Success from a One-Line Blurb with Jev and Maia
October 28, 2026
Blog
7 mins
Summarise with AI
Structured data tells you a lot about whether a crowdfunding campaign will succeed: the goal, the category, whether there is a video. But every Kickstarter project also has a one-line blurb, the creator’s pitch to backers. We asked a simple question: if we turn that blurb into a handful of interpretable feature flags with Jev, does a model get better at predicting success? On 40,000 projects the answer is a clear yes: test AUC rose by +0.035 for logistic regression and +0.027 for gradient boosting, and the models missed roughly a quarter fewer successful campaigns.
A note on the choice of data: Kickstarter is not the point here. We picked it purely because it is a public dataset that pairs a short piece of free text with a clear yes/no outcome, which makes it a good showcase for the flag-creation technique. The same approach applies to any data where people write text alongside a result you care about: support tickets and churn, sales notes and won deals, claims descriptions and fraud, job applications and hires.
The Technique
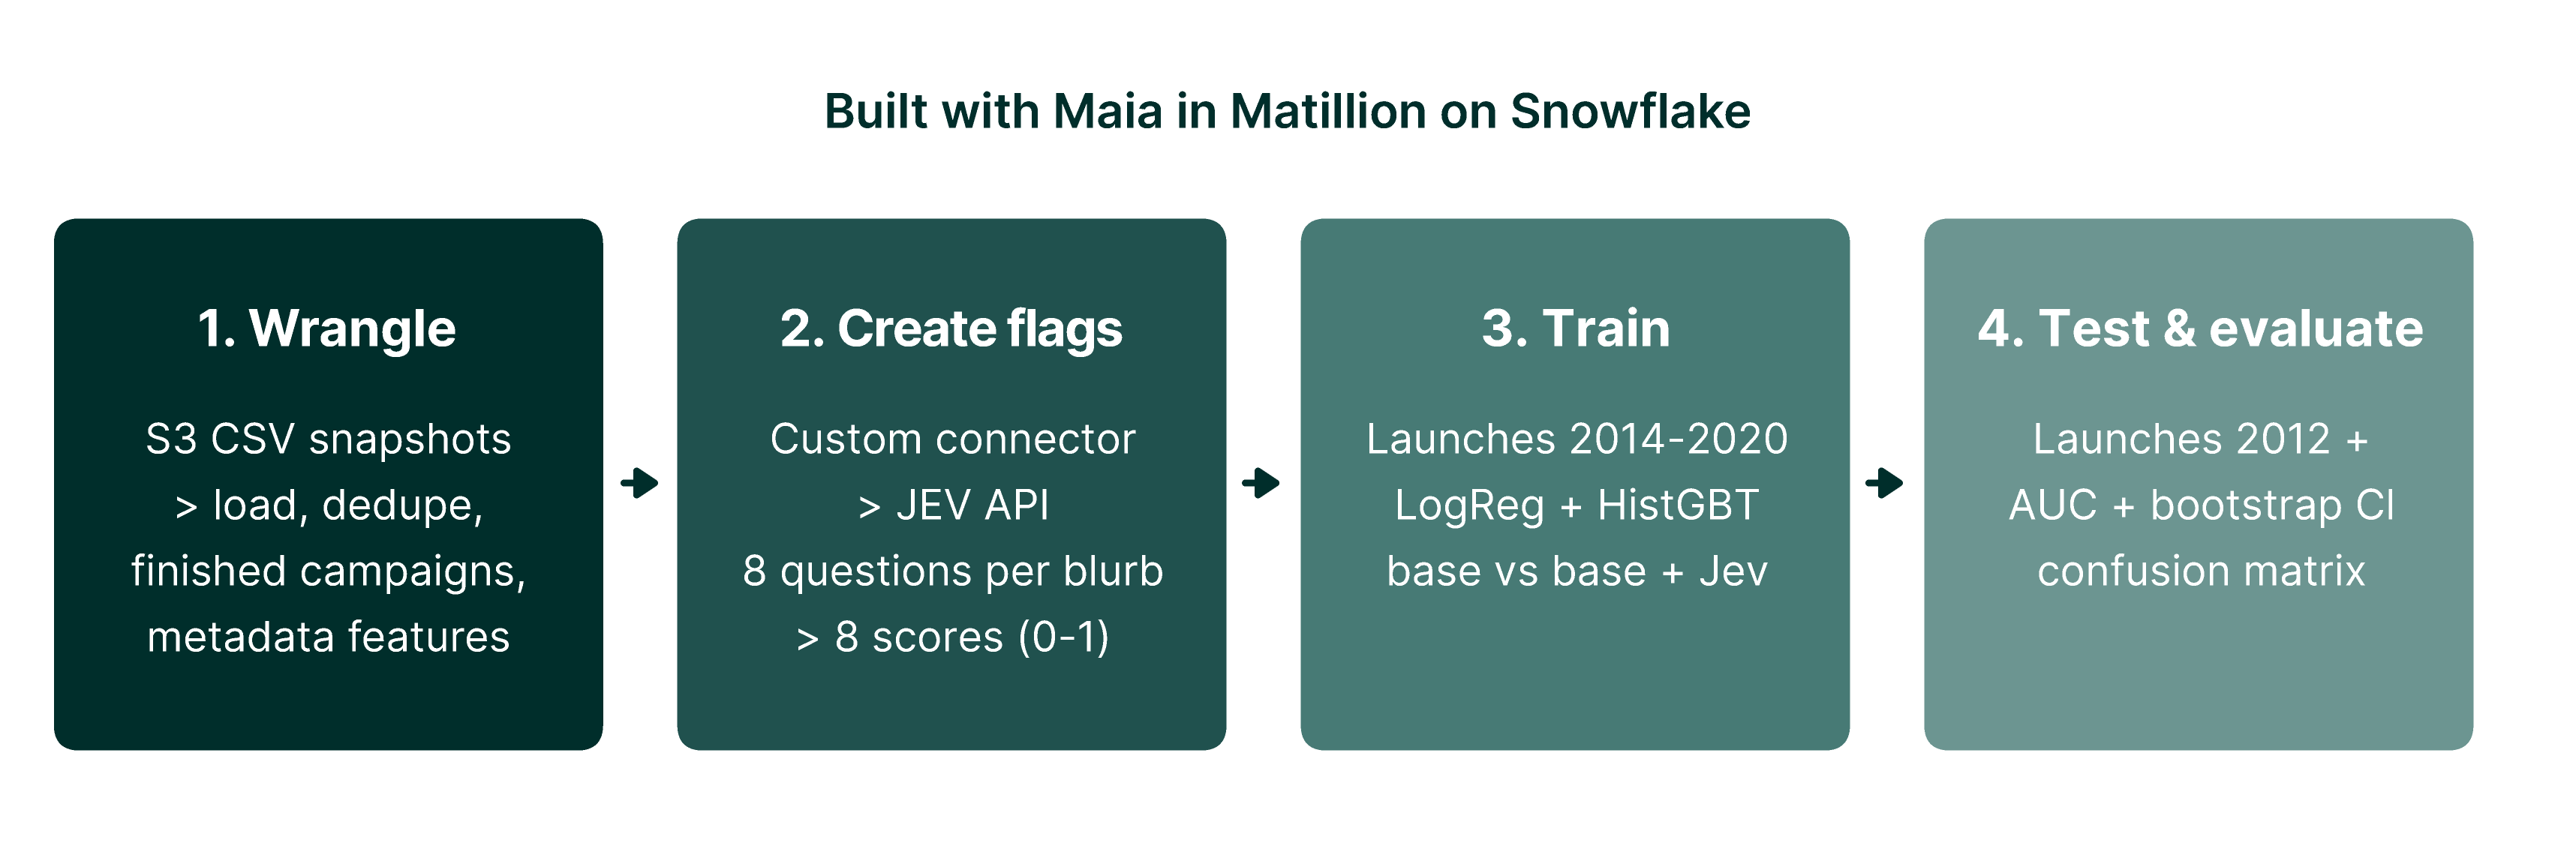
The whole workflow was built with Maia, Matillion’s AI data automation agent, working in the Matillion pipeline designer against a Snowflake warehouse. It breaks into four stages:
Wrangle the data. Maia built low-code pipelines to unzip and load the raw monthly CSV snapshots from S3, remove duplicates so each project appears once, keep only finished campaigns, and derive simple features such as goal size, campaign length, days of preparation and whether a video was included.
Create the flags. Maia set up a custom connector to the Jev API and a loop that sends each blurb, with the eight questions, to Jev and stores the answers. A transformation then turns each answer into a numeric column, so every project ends up with eight new features scored from 0 to 1.
Train. A model learns the relationship between the features and the outcome from historical examples. We trained two common types: logistic regression, which gives each feature a weight and adds them up, and gradient-boosted trees (HistGBT), which combine hundreds of small decision rules and can capture interactions.
Test and evaluate. The real test of a model is how it does on data it has never seen. We trained only on campaigns launched 2014–2020 and tested on campaigns launched 2021 onwards, mimicking predicting the future from the past. We ran each model twice, once on the metadata alone (the baseline) and once with the Jev flags added, so any difference is down to the text.
Figure 1. The four-stage workflow: wrangle the data, create Jev flags via a custom connector, train, then test and evaluate.
Two measures are used to judge the models. AUC (area under the ROC curve) asks: if you pick one successful and one failed campaign at random, how often does the model rank the successful one higher? 0.5 is a coin toss and 1.0 is perfect. The confusion matrix instead counts the outcomes of yes/no predictions: true positives (TP, correctly predicted successes), false positives (FP, predicted to succeed but failed), true negatives (TN) and false negatives (FN, predicted to fail but succeeded). Precision is the share of predicted successes that were real; recall is the share of real successes the model found.
Jev scores a piece of text against natural-language yes/no questions and returns a probability for each. Rather than embeddings or a black-box classifier, we wrote eight hypotheses about why campaigns succeed and asked Jev to score every blurb against all eight in a single call. Each answer becomes a numeric feature alongside the usual metadata.
Data: webrobots.io Kickstarter snapshots, de-duplicated to one row per finished campaign, 2014 onwards (earlier years show survivorship bias).
Leakage control: only pre-launch information is used; pledged amount, backers and staff pick are excluded.
Pipeline: built entirely in Matillion. A Table Iterator calls the Jev connector 16 at a time, resumable in 20k batches; scoring cost is about $0.03 per 1,000 blurbs.
Evaluation: out-of-time split, training on 2014–2020 launches (20,432) and testing on 2021+ (19,568), with a paired bootstrap for the AUC gain.
The Eight Flags
Flag
What Jev is asked
% flagged
Success if flagged
Success if not
Correlation
concrete_product
Describes a specific tangible deliverable rather than a vague cause
72%
69%
41%
+0.31
low_effort
Short, vague or poorly written
56%
53%
71%
-0.25
established_creator
Signals an experienced creator or track record
17%
79%
57%
+0.18
charity_cause
Frames the project as a charitable cause
3%
44%
61%
-0.11
personal_appeal
Asks backers to fund the creator’s personal needs
4%
45%
62%
-0.10
enthusiastic_tone
Energetic, emotive language
52%
63%
58%
+0.06
innovation_claim
Claims to be new, innovative or first-of-its-kind
5%
59%
61%
+0.00
clear_value
Clearly explains what it is and why it matters
56%
61%
61%
-0.00
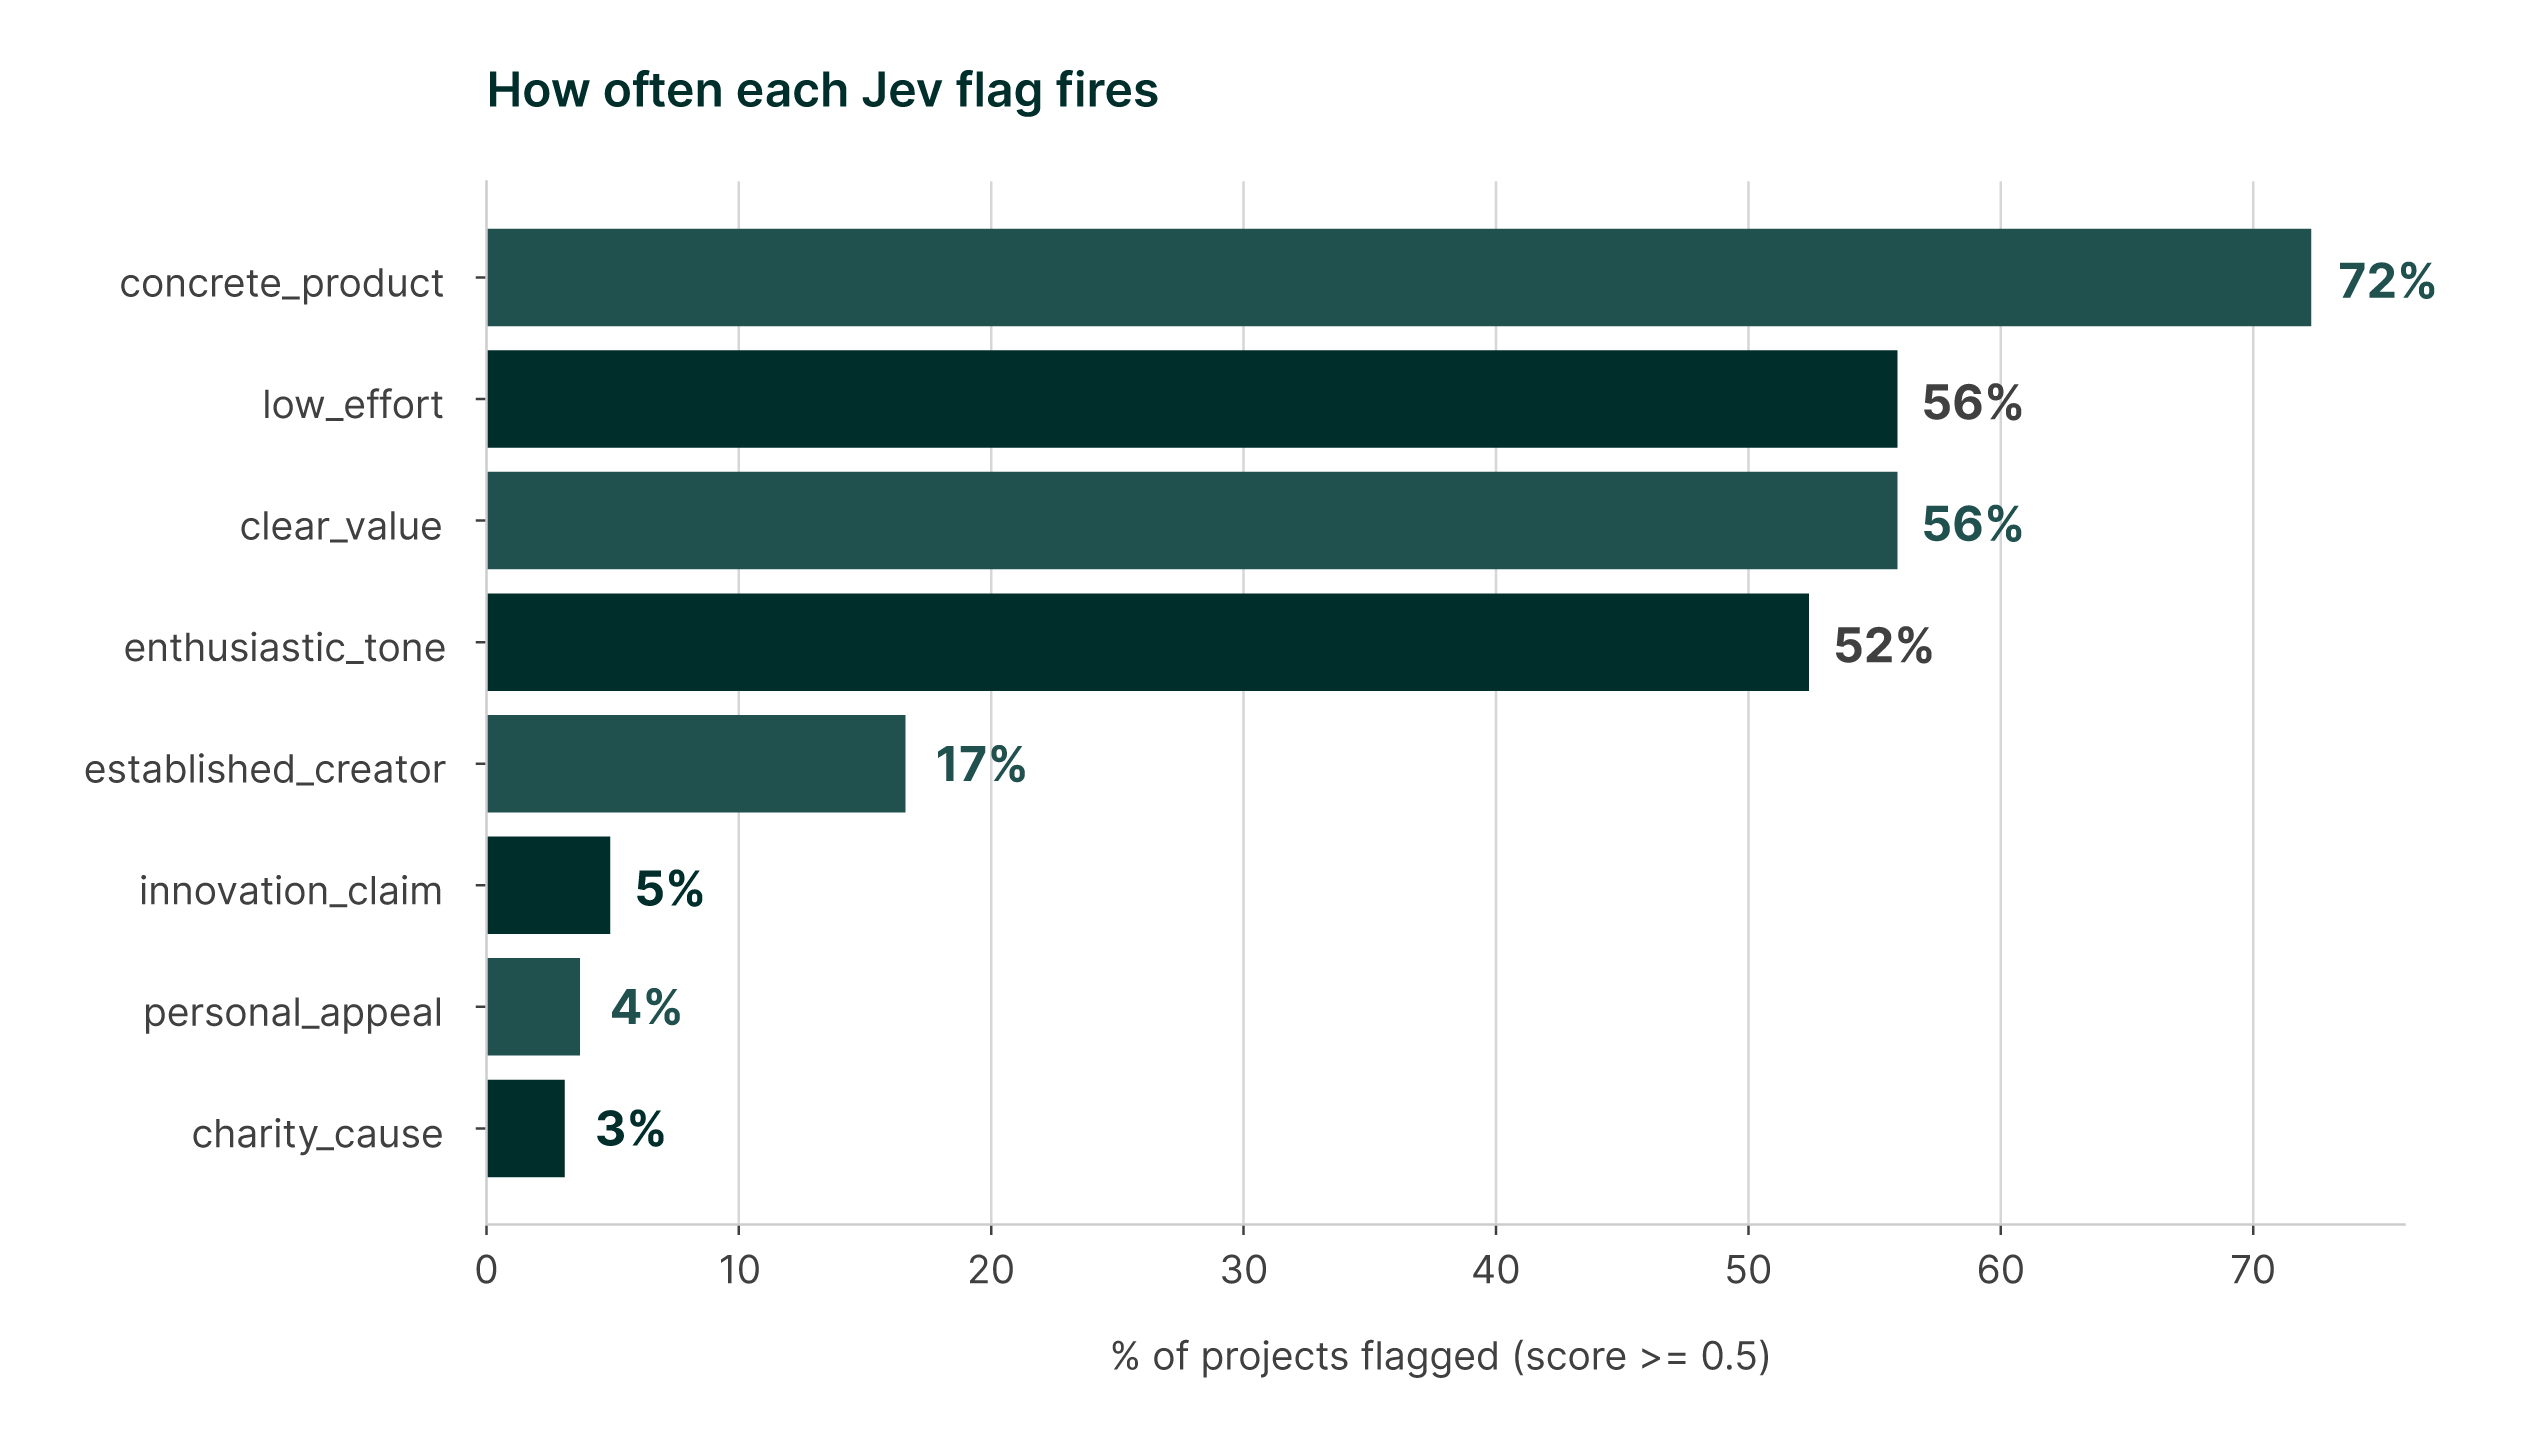
Figure 2. Share of projects where each flag scores 0.5 or above (n=40,000).
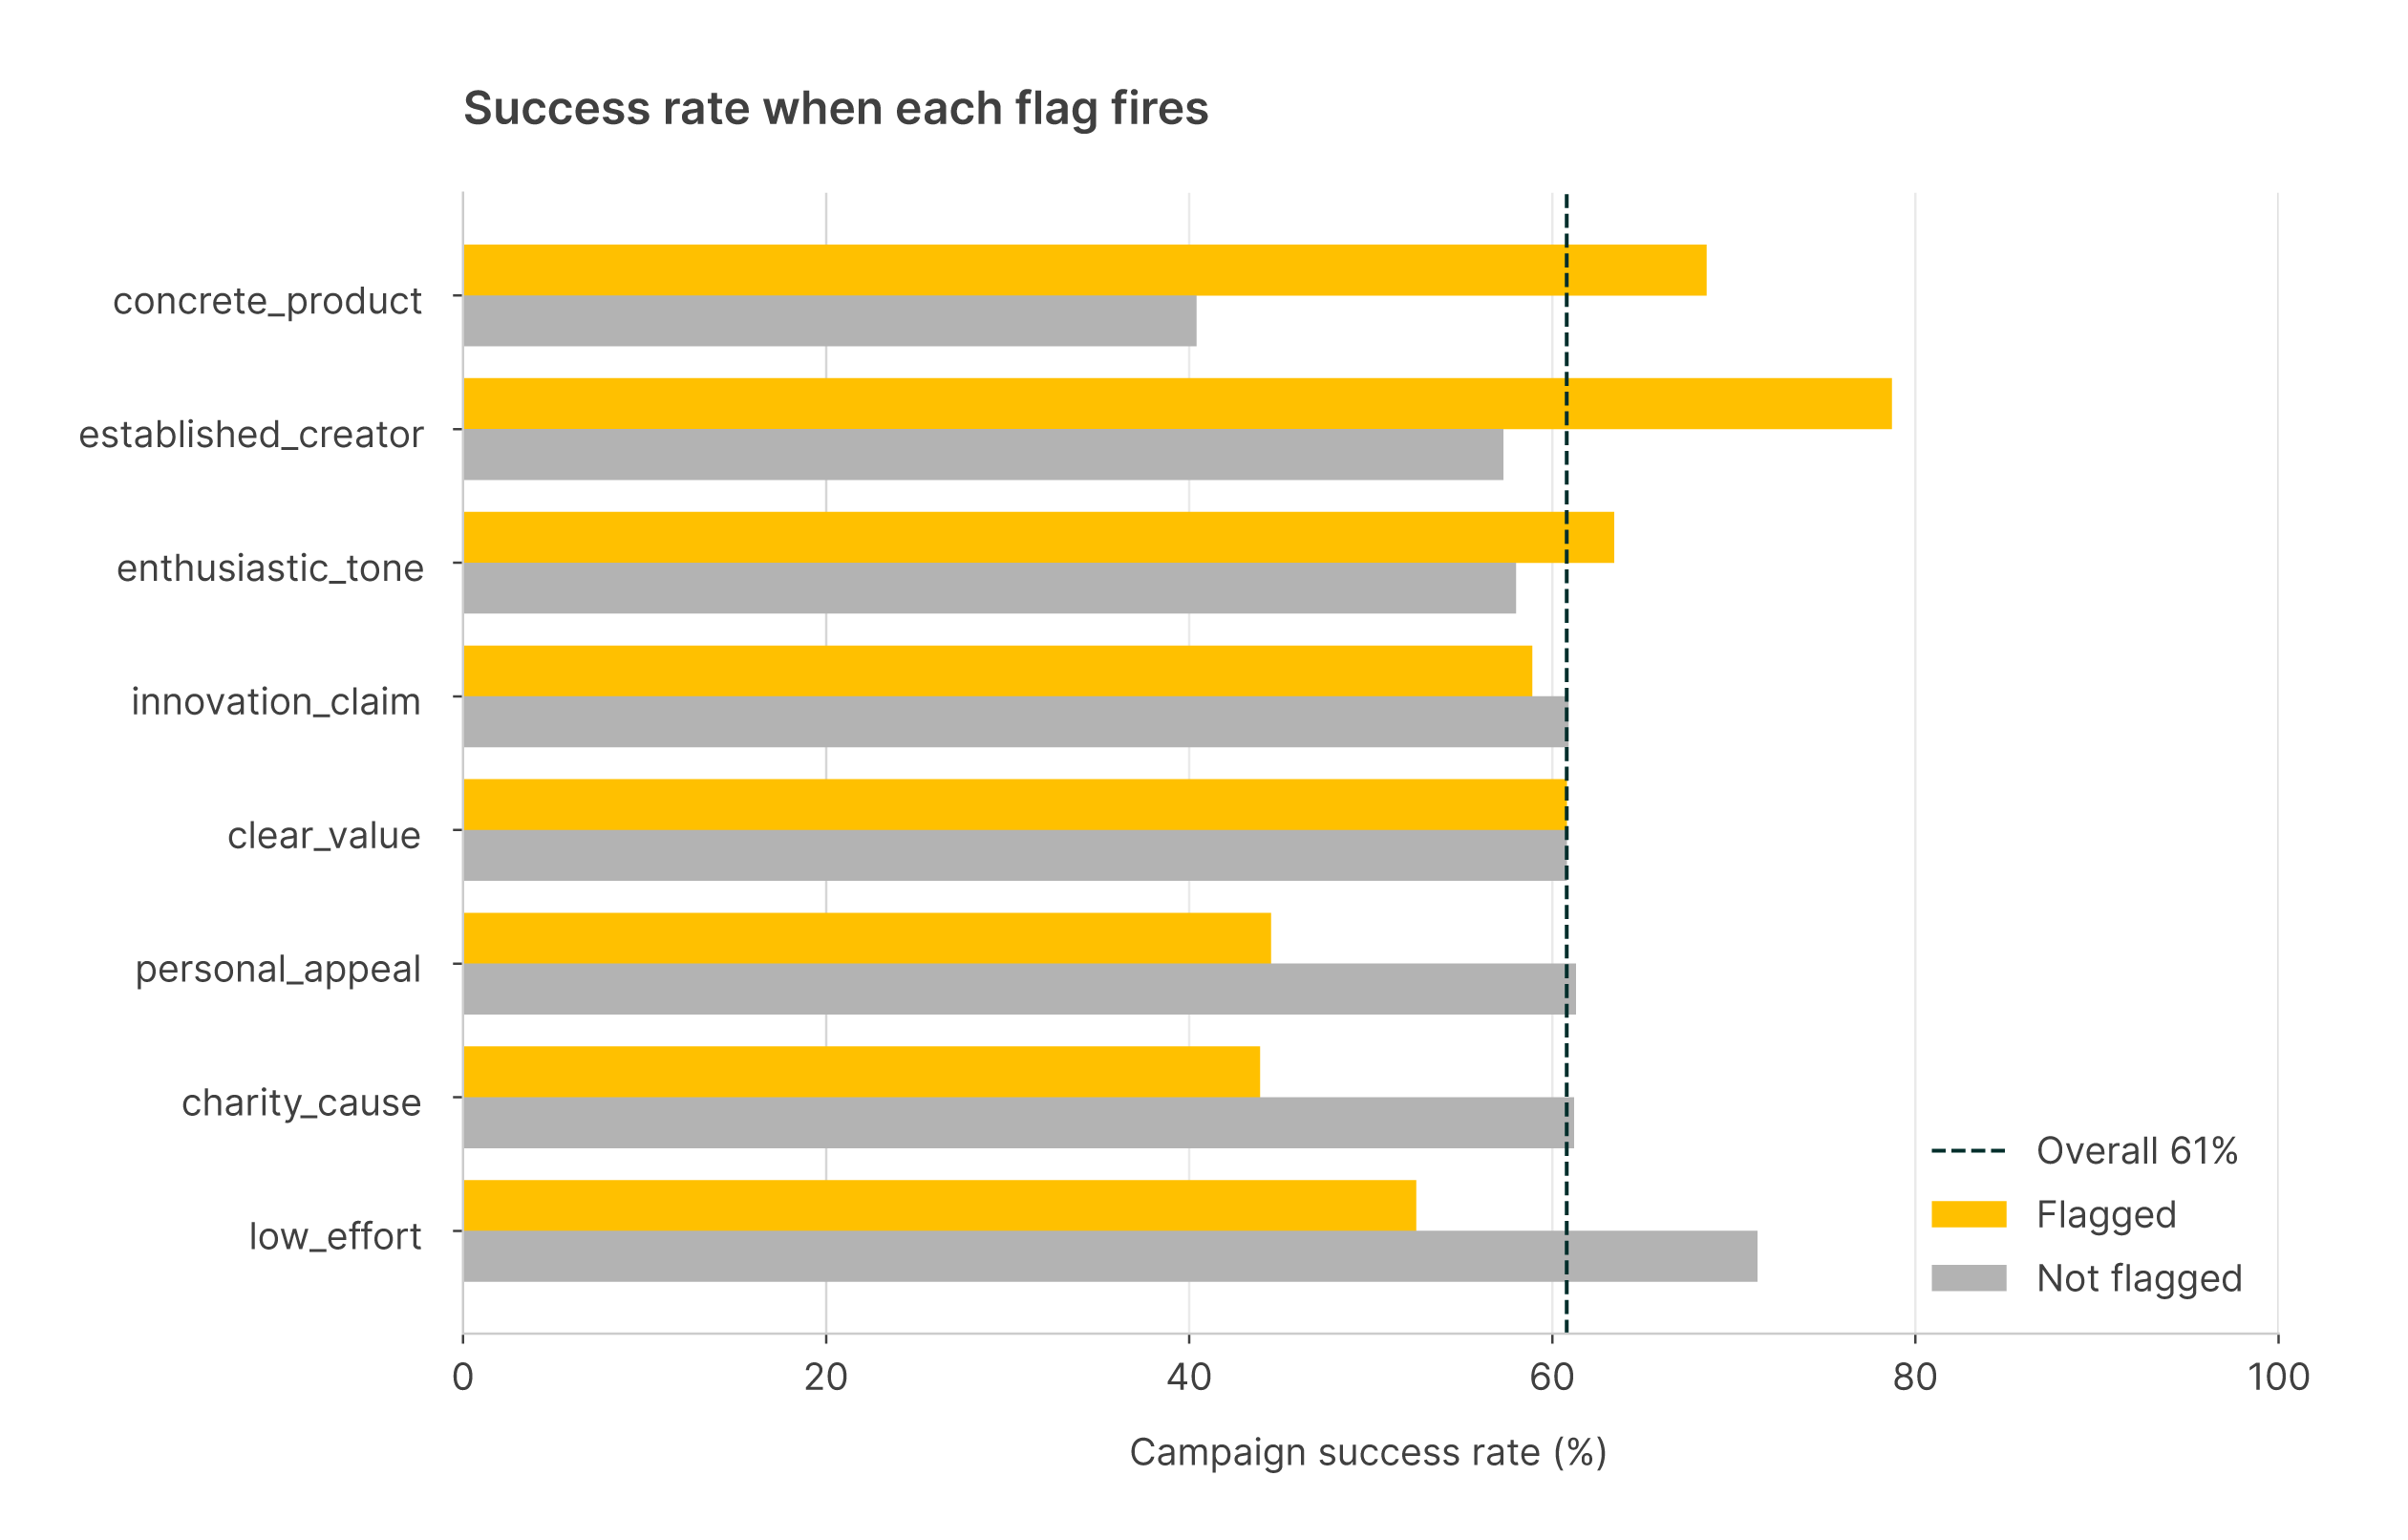
Figure 3. Success rate of flagged vs non-flagged projects.
Three flags do the heavy lifting. A blurb describing a concrete product succeeds 69% of the time versus 41% for those that don’t. A low-effort blurb drops success from 71% to 53%. Signs of an established creator push it to 79%. Charity and personal appeals are rare but costly, while tone, clarity and innovation claims show almost no signal on their own. These effects held within every main category in our pilot, so they are not just category proxies.
Results: AUC
Model
Features
Test AUC
Gain vs base (95% CI)
LogReg
Base metadata
0.727
LogReg
Jev flags only
0.714
-0.013 (-0.024 to -0.001)
LogReg
Base + Jev
0.762
+0.035 (+0.032 to +0.038)
HistGBT
Base metadata
0.739
HistGBT
Jev flags only
0.717
-0.022 (-0.033 to -0.012)
HistGBT
Base + Jev
0.767
+0.027 (+0.024 to +0.031)
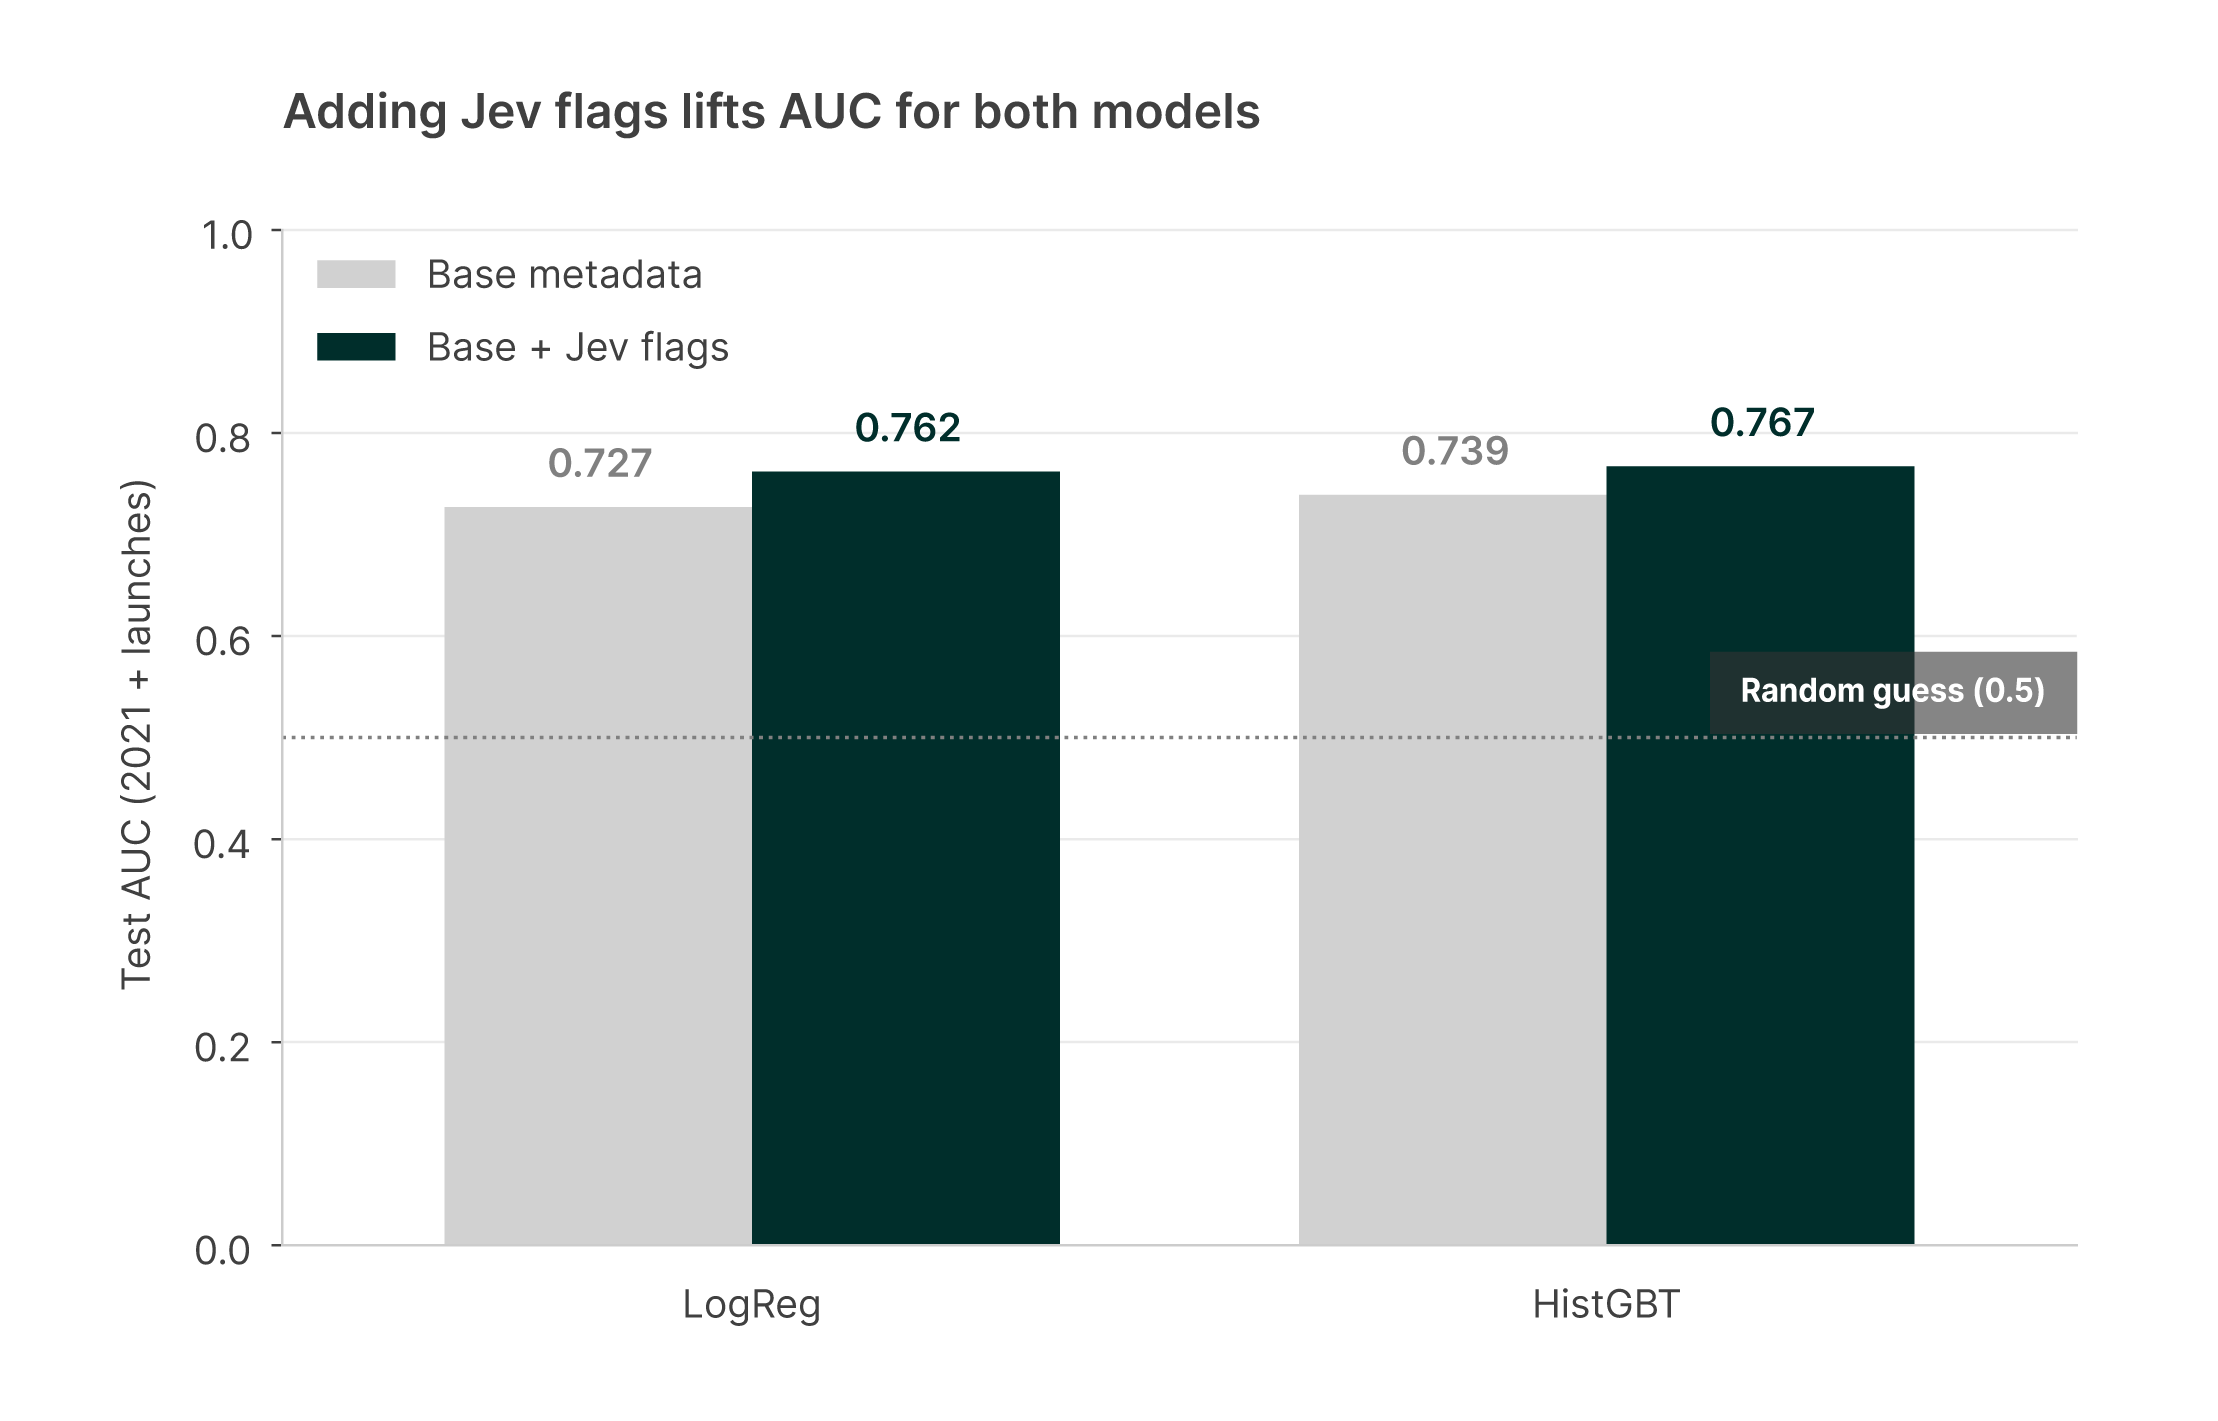
Figure 4. Test AUC on 2021+ launches, base metadata vs base + Jev flags.
The eight flags alone reach an AUC of 0.714, nearly matching all the metadata combined (0.727). Together they are clearly complementary, and the confidence intervals sit well clear of zero. Adding raw text length on top adds nothing: it is what the blurb says, not how long it is. For comparison, the same approach on Lending Club loan descriptions added only +0.0025 AUC, roughly a fourteenth of this lift.
Results: Confusion Matrix and False Negatives
Model
Features
TP
FP
TN
FN
Precision
Recall
Accuracy
LogReg
Base
10,603
2,473
3,357
3,135
81.1%
77.2%
71.3%
LogReg
Base + Jev
11,236
2,441
3,389
2,502
82.2%
81.8%
74.7%
HistGBT
Base
11,354
2,538
3,292
2,384
81.7%
82.6%
74.8%
HistGBT
Base + Jev
12,024
2,576
3,254
1,714
82.4%
87.5%
78.1%
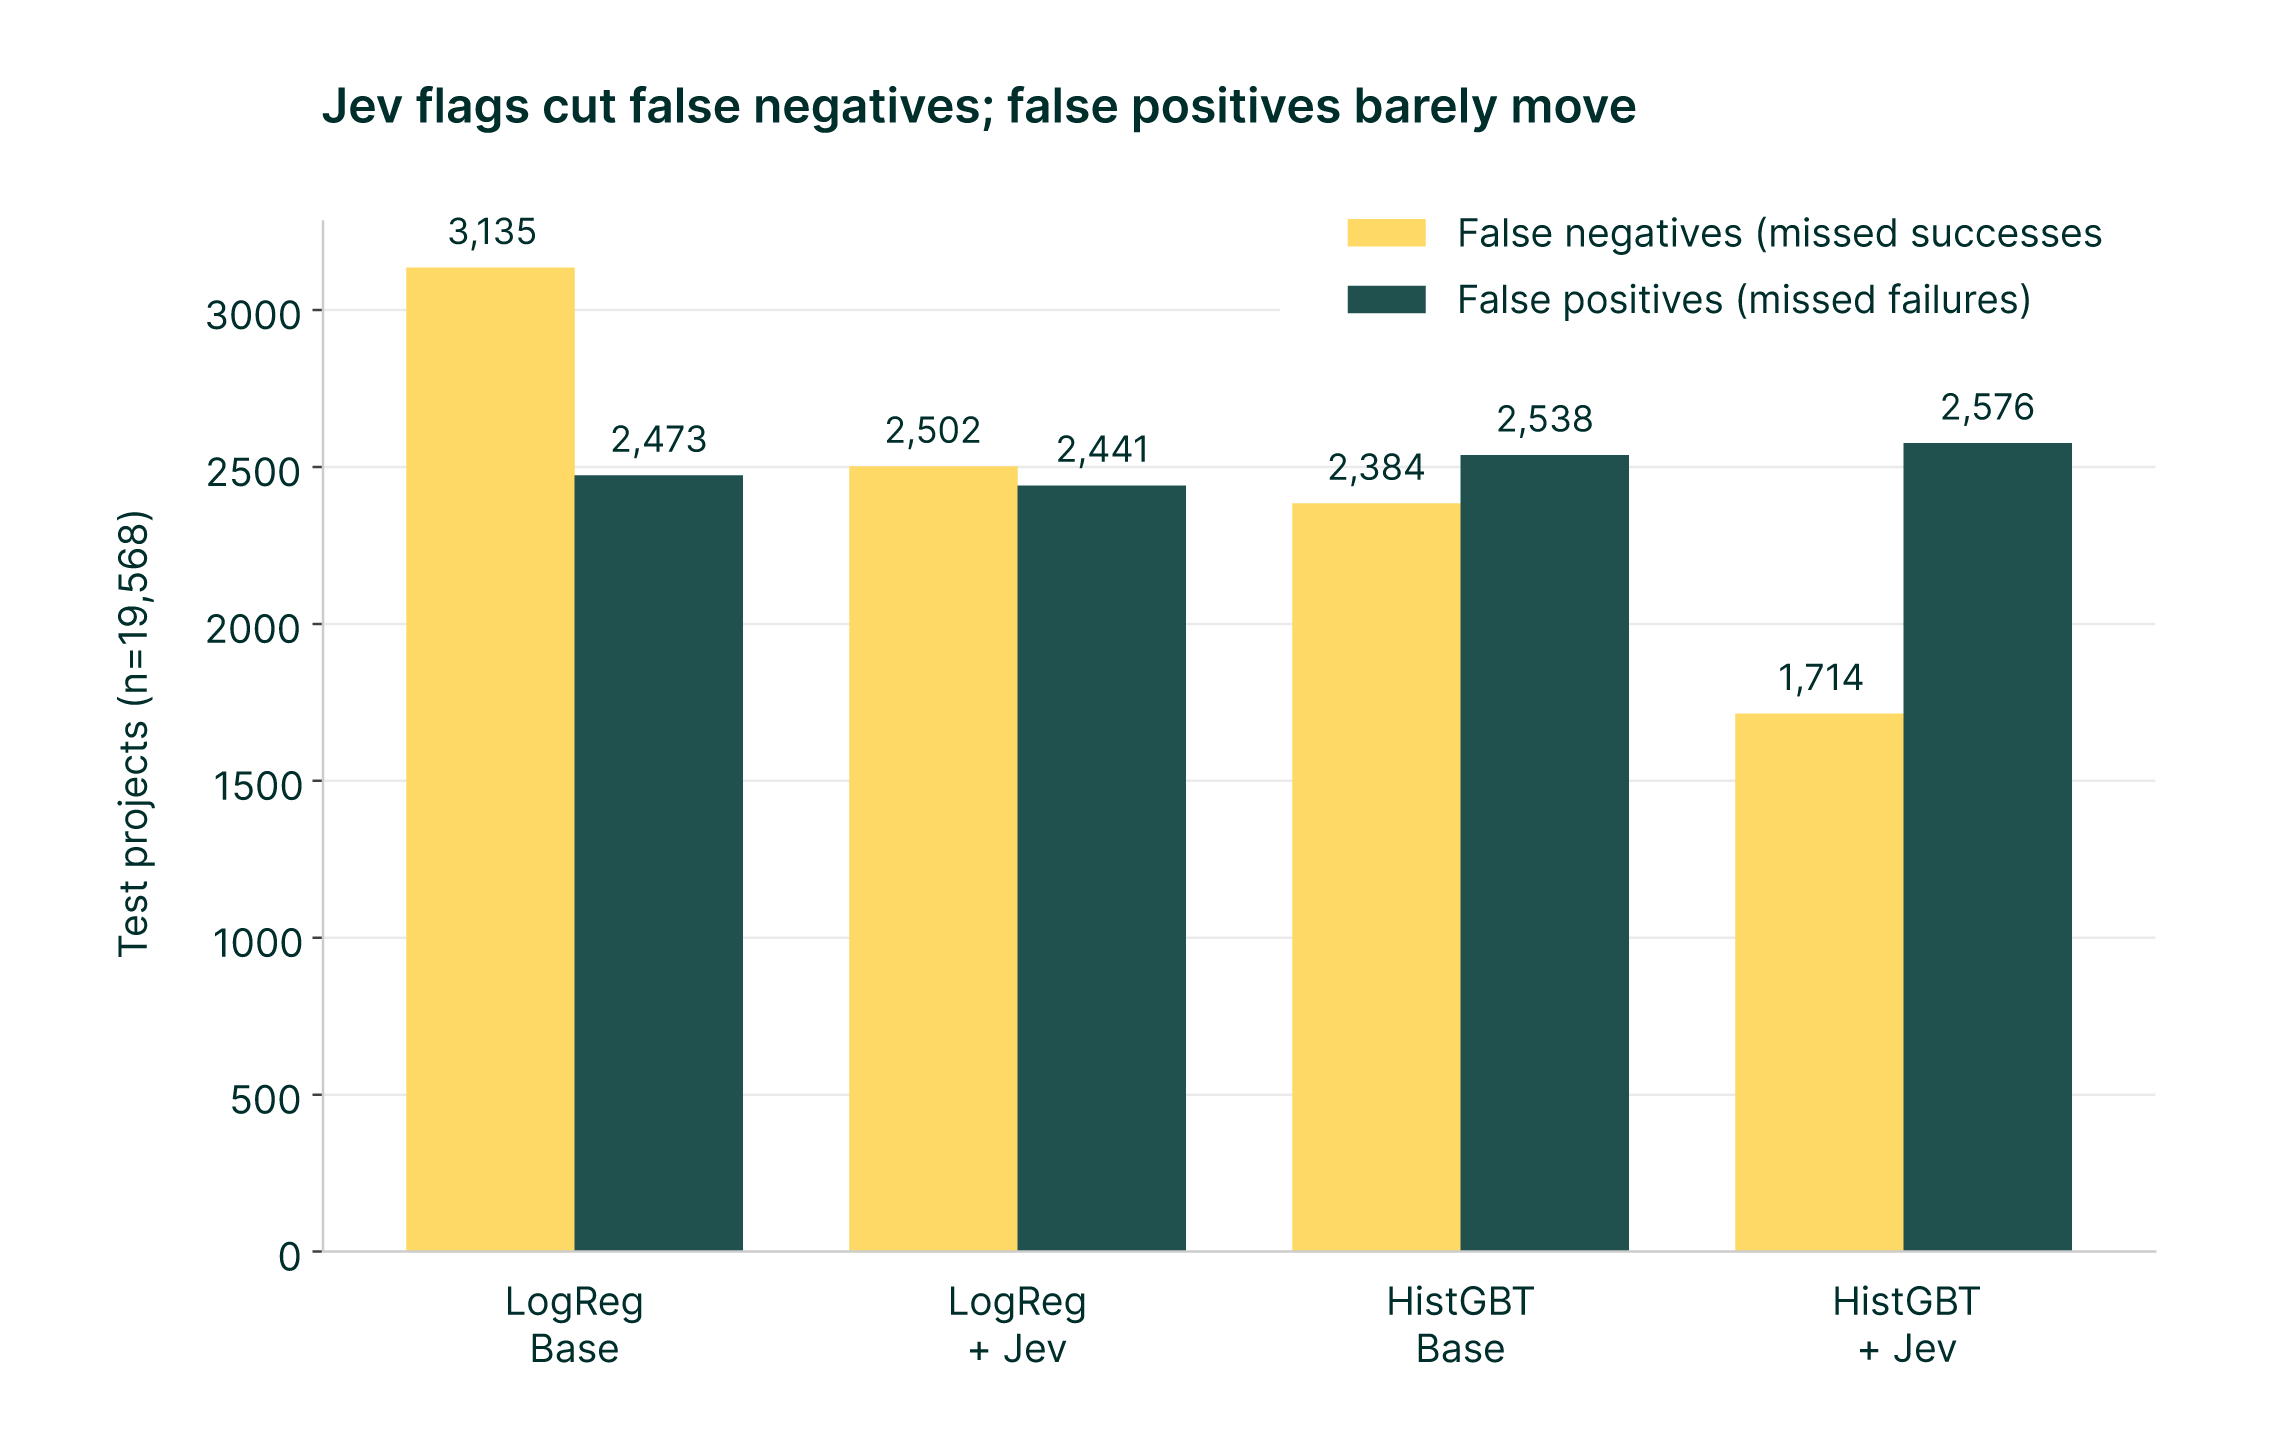
Figure 5. False negatives and false positives at a 0.5 threshold (positive = successful campaign).
LogReg: false negatives fell by 633 (20%), false positives changed by -32.
HistGBT: false negatives fell by 670 (28%), false positives changed by +38.
The flags mainly rescue good campaigns that the metadata misjudges: projects with a big goal or no video whose concrete, well-written pitch shows they are viable. Recall on successful campaigns rises by almost five points for both models while precision also edges up. Failures are mostly already predictable from goal, video and prep time, so false positives barely move. Note that the 70% success rate in the test years versus 52% in training biases the 0.5-threshold figures toward false negatives; the AUC comparison does not depend on the threshold.
Lessons
Write flags as hypotheses. Interpretable flags make the result explainable as well as predictive.
Pilot first. A 5,000-row stratified pilot cost about $0.13 and predicted the full-scale lift.
Measure lift with logistic regression or boosting. A single decision tree spent its splits on goal and video and showed almost no gain.
Text matters when it is the creator’s pitch to the decision-maker. The Kickstarter blurb is exactly that.
Try It on Your Own Data
You do not need Matillion or Kickstarter to use this approach. The recipe, in short:
Assemble one row per entity with a stable ID, the outcome (0/1), the free text, and the structured fields you would already use. Keep only information known before the outcome happened, otherwise the model cheats.
Write 6-10 yes/no questions as hypotheses about why the outcome happens: substance (is something concrete described?), effort or quality, credibility, framing, and one or two tone questions as controls. Do not ask about anything the structured fields already capture.
Score the text with Jev, sending all questions in one call per row (you pay for the text once). Include the row ID in the request so answers can be joined back, and make the job resumable so it can be stopped and restarted.
Pilot on about 5,000 rows with a 50/50 mix of outcomes. Check each flag: how often it fires, and the outcome rate when it does versus when it does not. Scale up only if the flags show signal.
Split by time: train on older records and test on newer ones. Compare a baseline model on structured fields with the same model plus the flags, using logistic regression and a boosted-tree model.
Judge the lift with AUC and a bootstrap confidence interval, then look at the confusion matrix to see which errors the flags fix. Do not judge it with a single decision tree, which tends to ignore many small signals.
Watch for traps: survivorship bias in early records, missing values stored as text, and outcome rates that drift between the training and test periods.
This article was written with help from Maia, Matillion’s AI data engineering agent, as a write-up of the working session in which the analysis was carried out. Maia used its skills to generate the charts with matplotlib and to assemble the source document, both inside a Snowflake Python pipeline, before saving them to a Snowflake stage.
See Maia Build Pipelines Like This
Book a demo and watch Maia take messy data from raw files to a working model, inside the Matillion pipeline designer.
Julian Wiffen, Chief of AI and Data at Matillion, leads a dynamic team focused on exploring how the latest breakthroughs in generative AI can transform data engineering. They collaborate closely with the software engineering to build and enhance Maia.