

Maia changes the equation of data work
Enjoy the freedom to do more with Maia on your side.


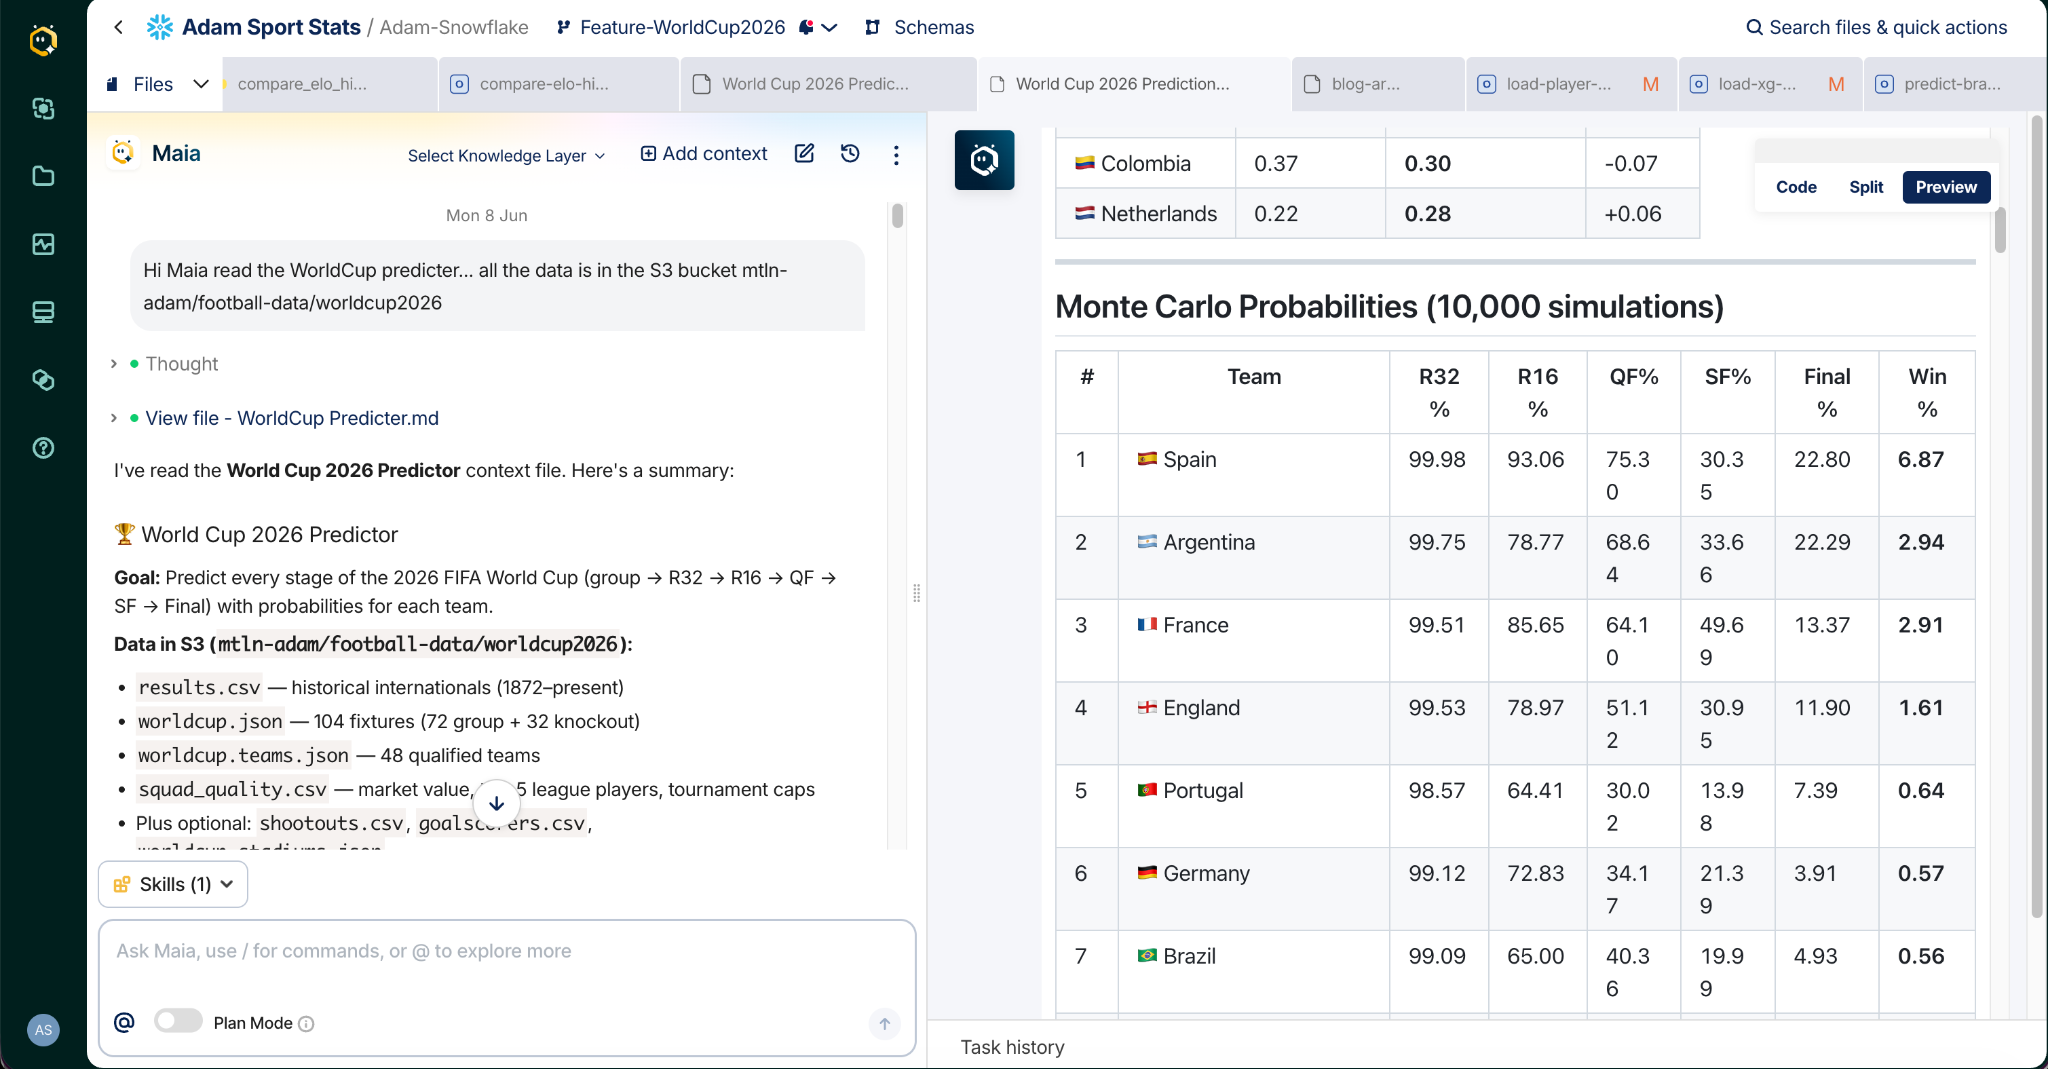
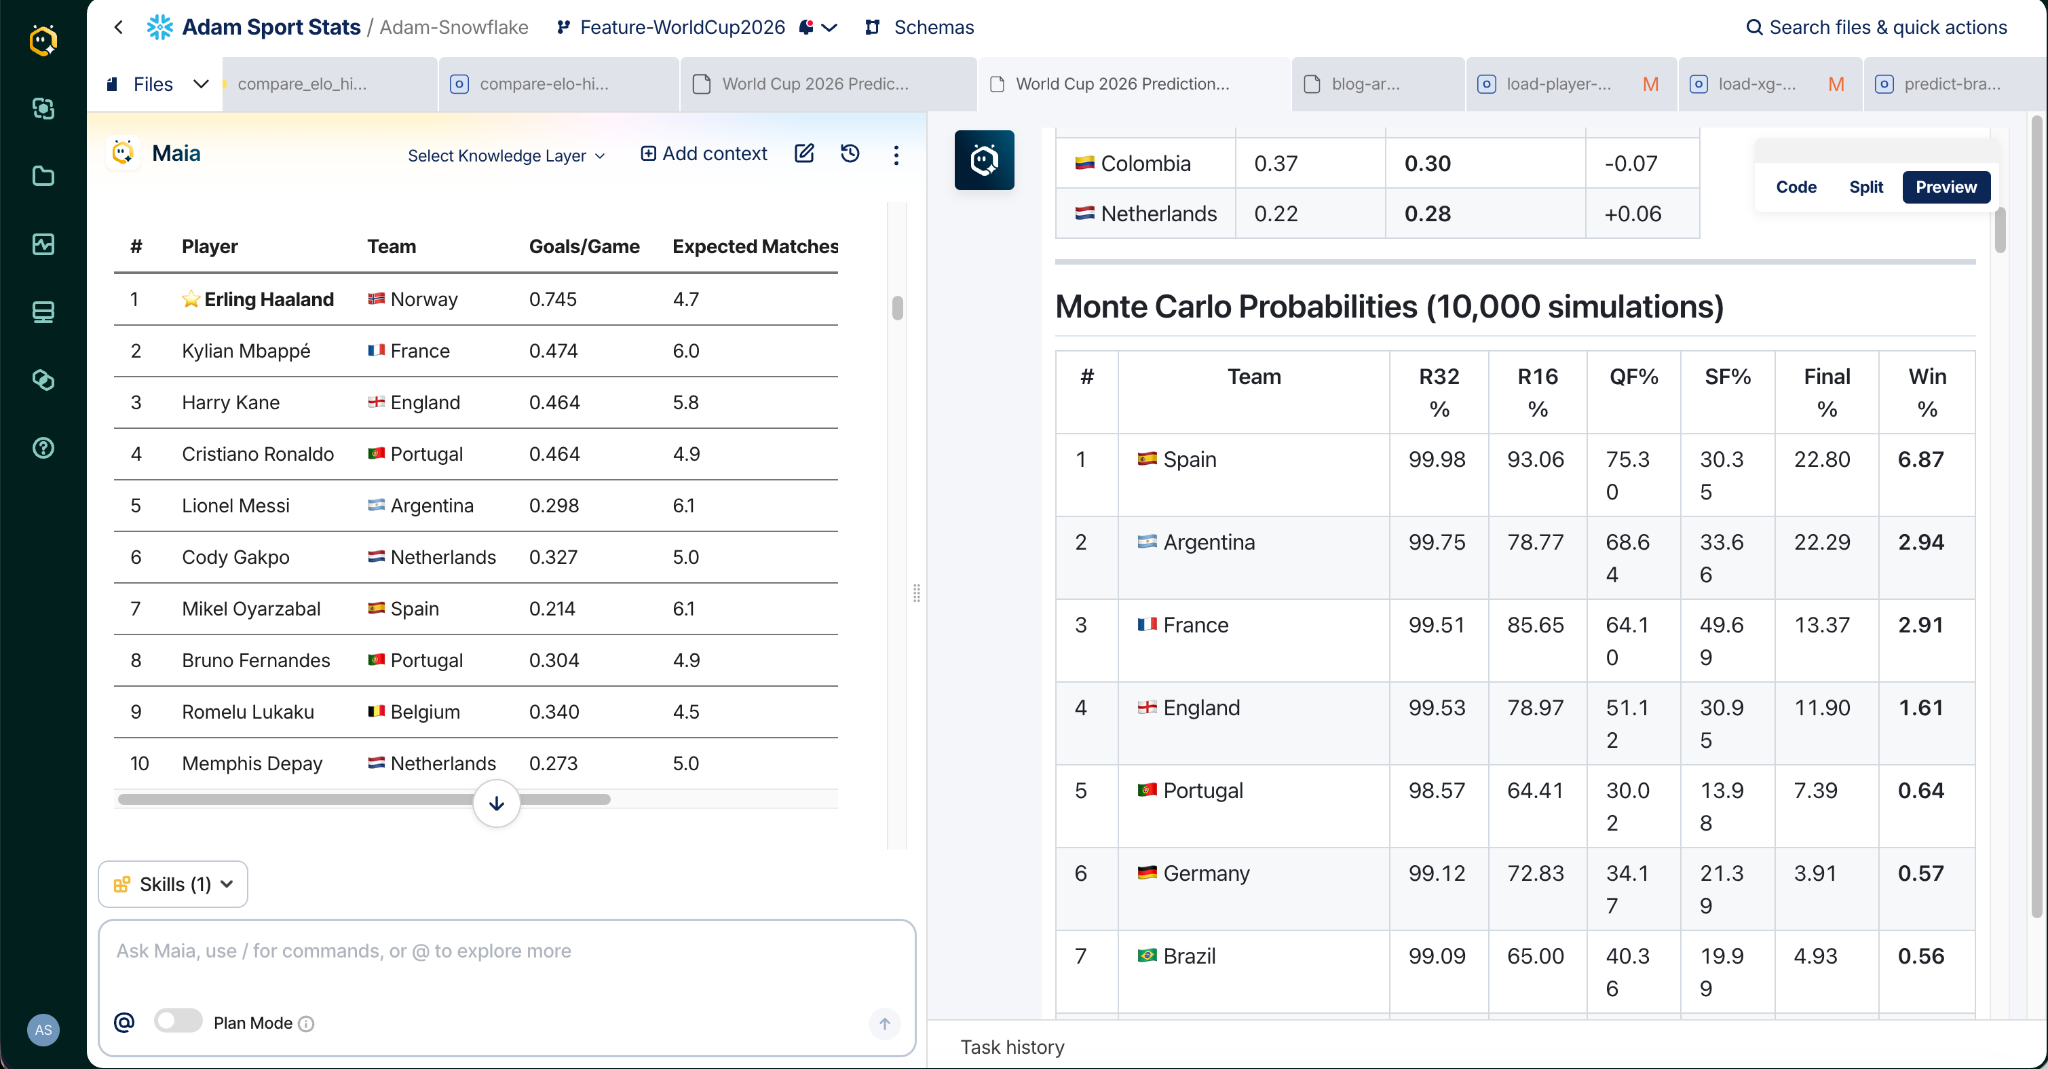
Spain are the most likely winners, with a 6.87% chance of lifting the trophy. That is the verdict of 10,000 Monte Carlo simulations run by Maia, Matillion's AI data automation platform.
That number might sound low. In a 48-team tournament where a purely random model gives every side around 2%, it's a commanding lead. More than triple random chance, and more than double any other team.
But the prediction isn't really the story. The story is how long it took to build, and what that says about how data work has changed. This post covers both: the full methodology, from Elo ratings to Poisson goal models, and the build itself.
Back in 2021, I built a prediction engine for the delayed Euro 2020 tournament. I did it entirely in Matillion ETL, because Maia didn't exist yet. Dozens of orchestration and transformation jobs to pull in match data, team stats, and historical results, then hand-built logic to predict every group stage and knockout result.
There was no Python and no simulation libraries. It was just transformation jobs, long hours, and months of evenings. The predictions turned out well. The process nearly didn't.

This month, with the 2026 World Cup about to kick off, I tried again. Same ambition, bigger tournament, one difference: this time I had Maia. The rebuild took a few hours.
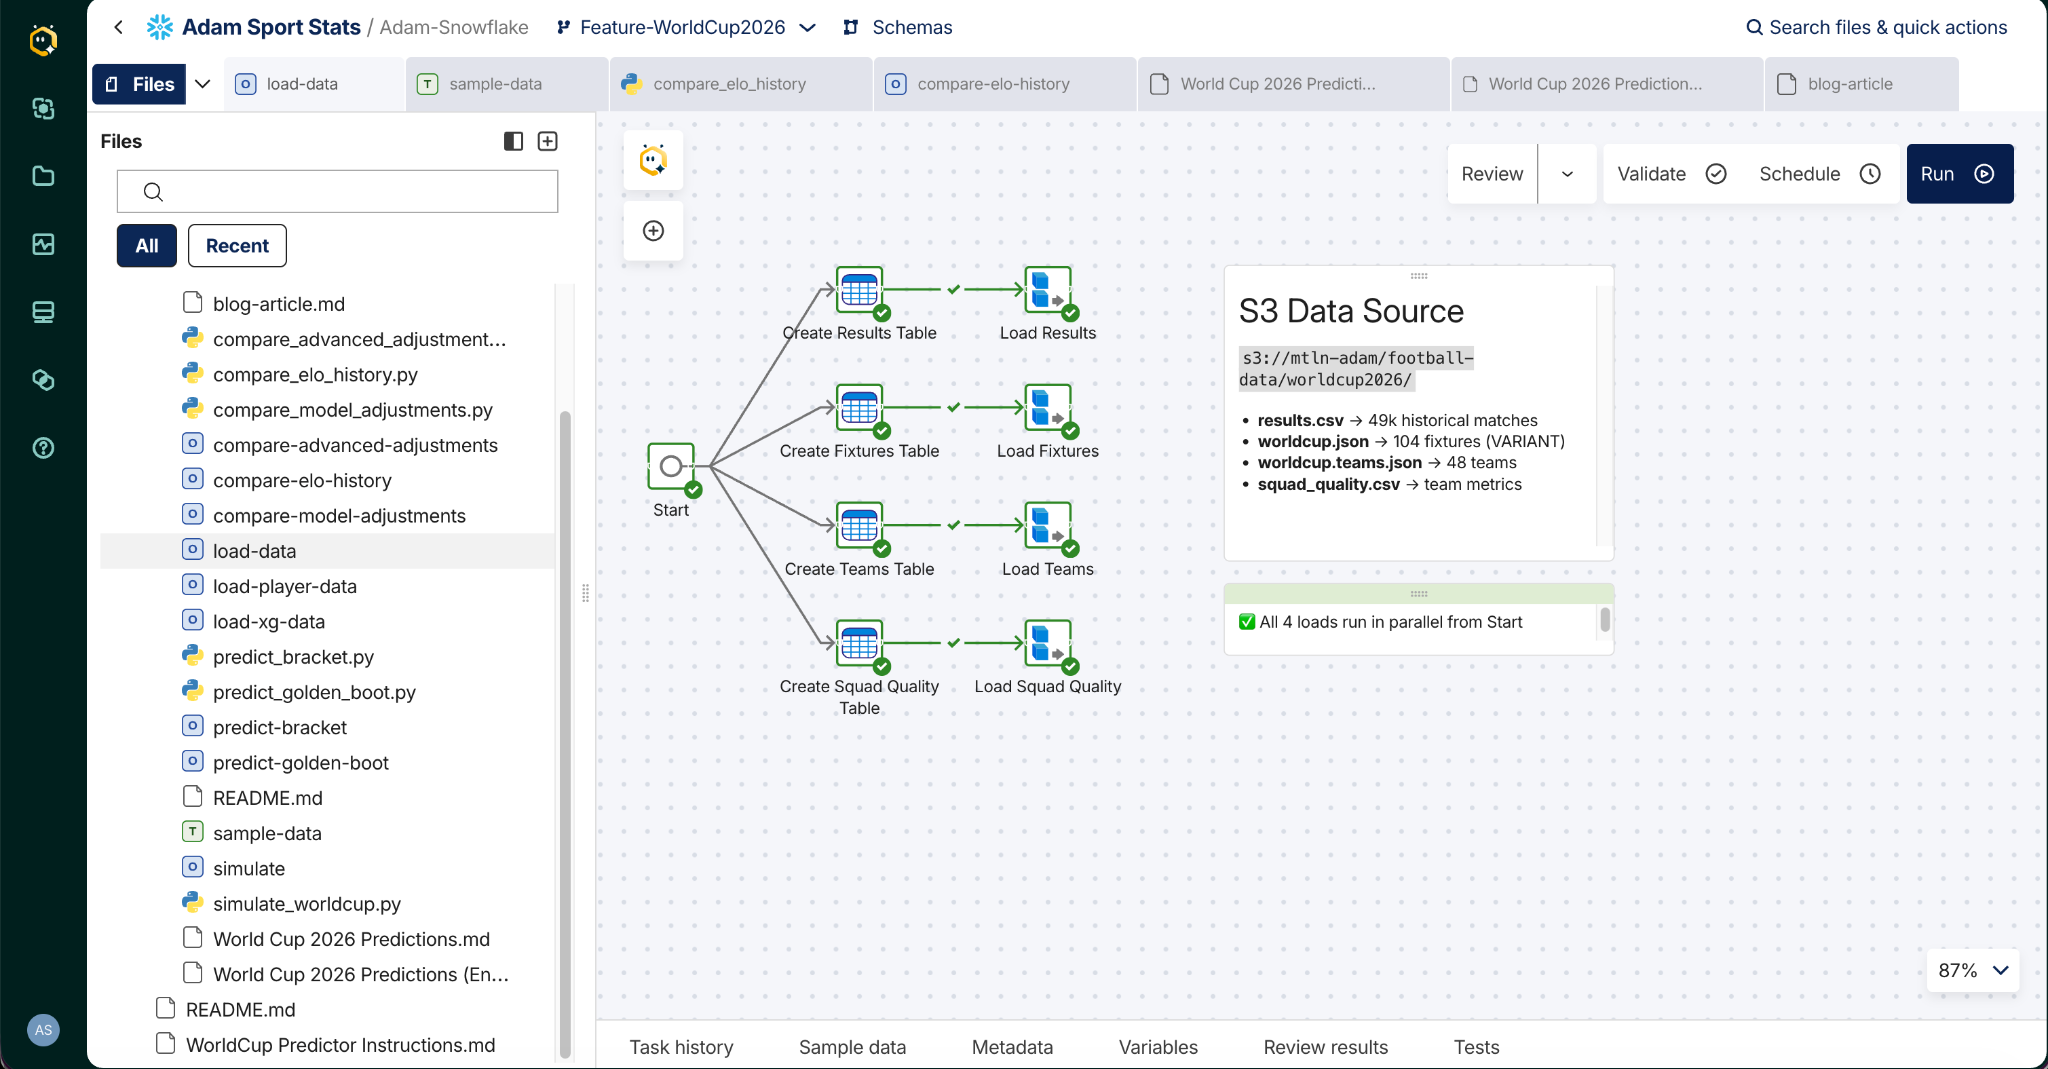
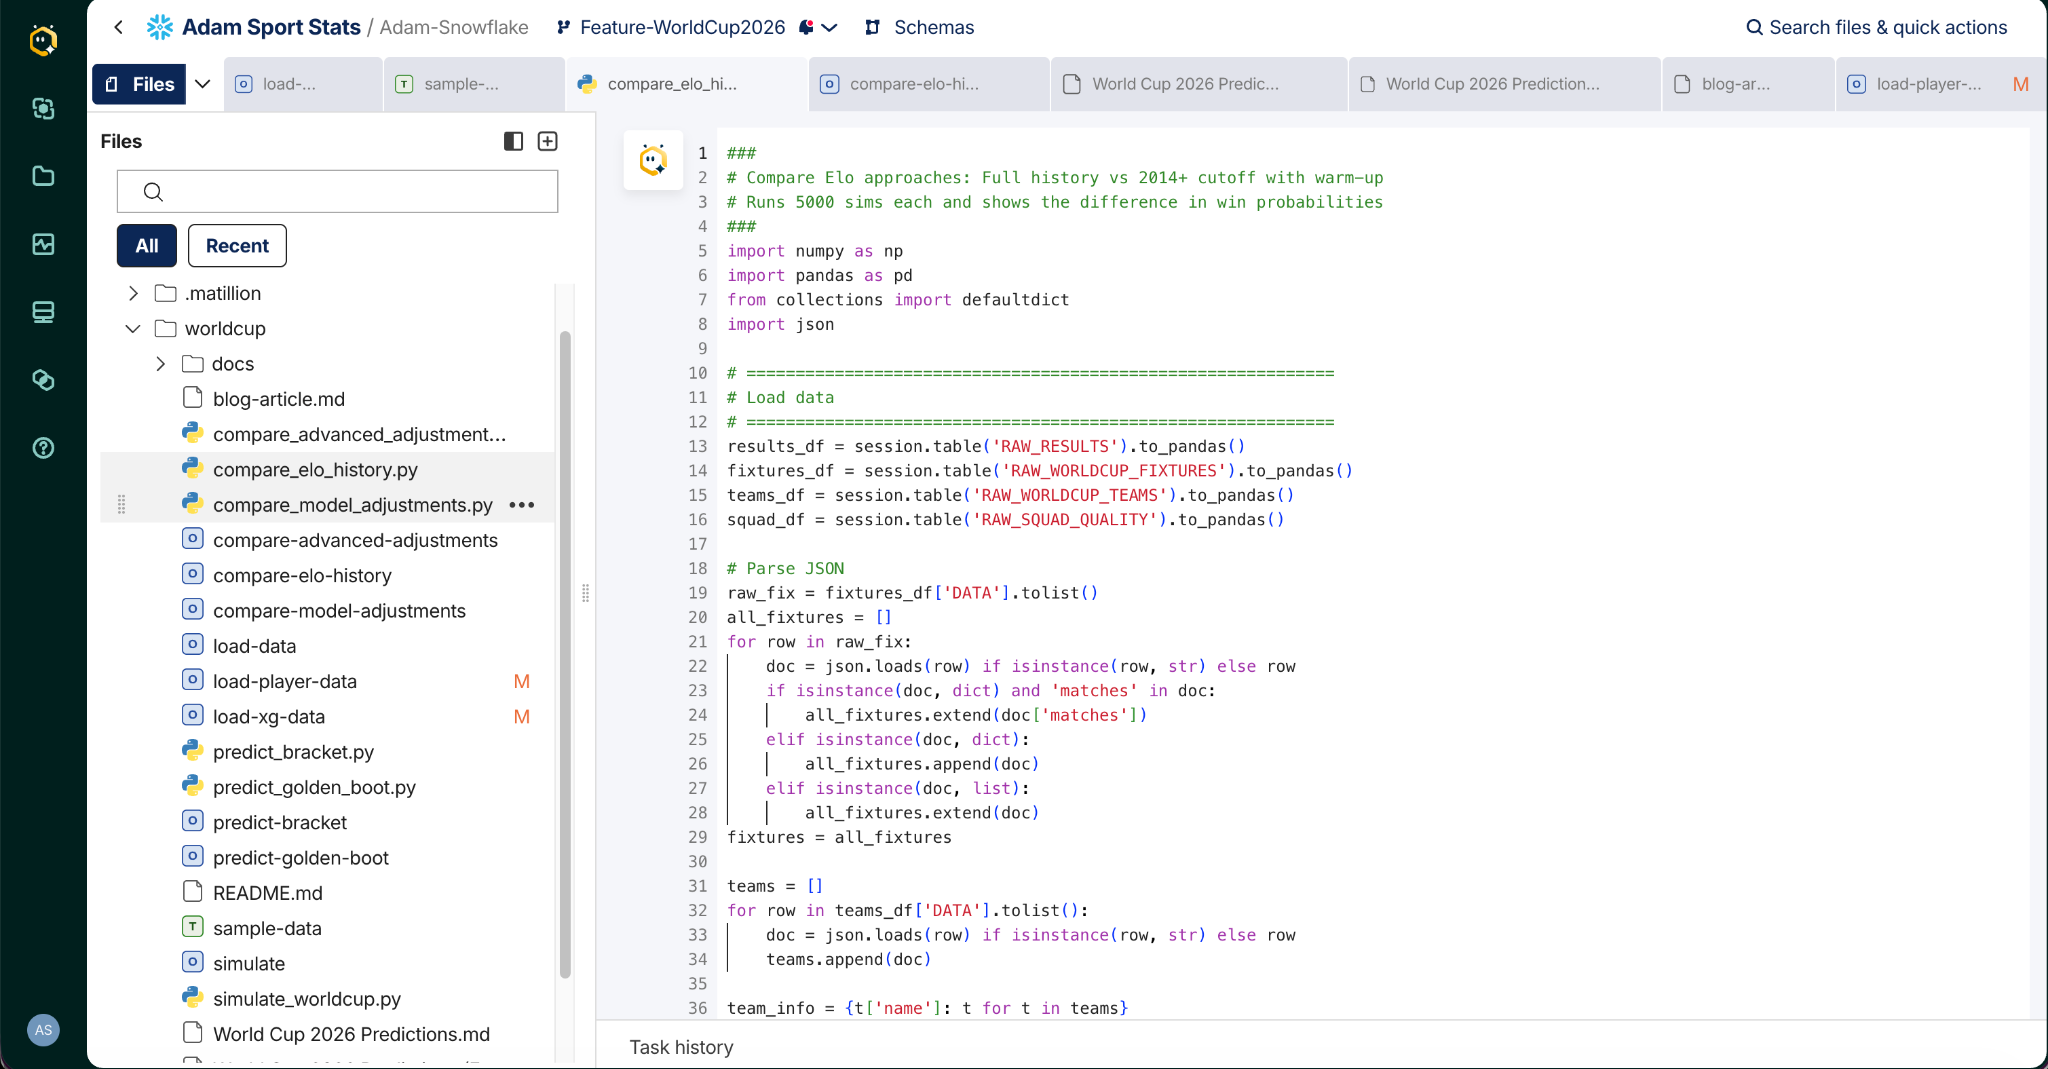
I loaded historical results, fixtures, and squad quality data, then asked Maia how it would approach predicting the tournament. We talked through the options. Should this be transformation jobs again, or Python? Maia's recommendation was Python, because of the statistical and simulation libraries available, and it proposed a Monte Carlo approach: simulate the entire tournament thousands of times and count how often each team wins.
Then it built the thing. Maia wrote the Python for the Elo ratings, the simulation engine, and the bracket generation, created the orchestration job to run it all, and pushed the compute down to Snowflake. It summarized every run into a markdown report I could read like a match preview.
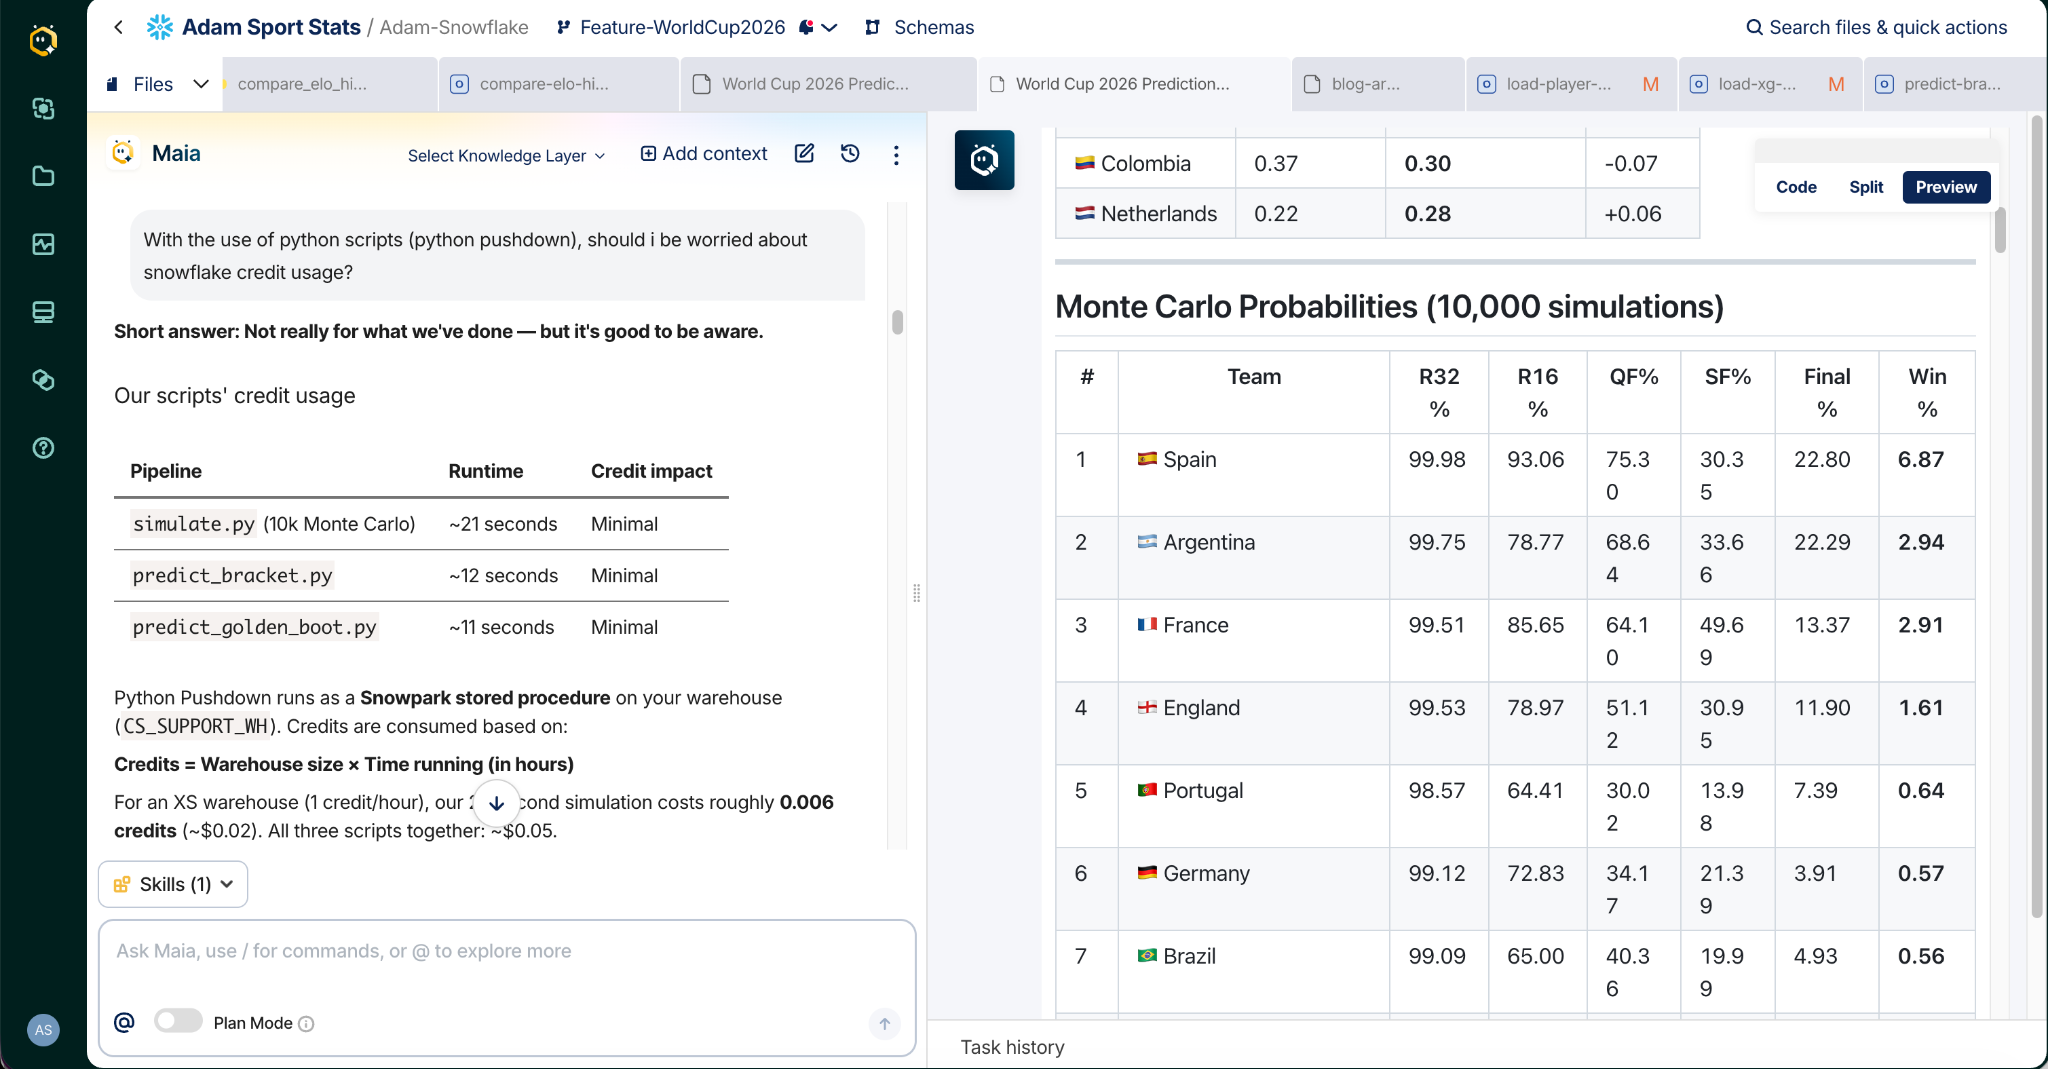
The 10,000-simulation run completes in about 21 seconds, and every script in the project finishes in under 30. I asked Maia whether I should be worried about Snowflake credit usage from the Python pushdown. Its answer: the entire project, all three scripts, cost roughly $0.05.
The foundation of the model is a custom Elo rating system, built from 49,000 international matches dating back to 1872.
Elo comes from chess. Every team holds a single number representing its strength. When two teams play, the winner takes points from the loser, and the size of the transfer depends on expectations: beat a top-10 side and your rating jumps, lose to a minnow and it falls hard. Over thousands of matches, the ratings converge on each team's true strength, and the gap between two teams' ratings translates directly into a win probability.
Maia's version adds four refinements:
Elo tells you who won. Expected goals tells you who deserved to.
xG measures the quality of chances a team creates and concedes, independent of whether they went in. The model takes net xG per 90 minutes from recent qualifiers and tournaments, z-scores it across all 48 teams, and adjusts each team's Elo by up to 50 points either way.
This is where the model gets opinionated. Spain's xG confirms their results: they're creating the best chances in world football, not winning ugly. France's underlying numbers are better than their recent results suggest. Argentina and Brazil go the other way; their results-based ratings flatter them relative to the chances they actually create.
Adding xG was the single most valuable enhancement in the whole project. It lifted Spain from 5.33% to 6.87%, a 29% increase in win probability, and it's the main reason Brazil, the most decorated nation in World Cup history, ranks just seventh.
Three more adjustments sit on top:
Squad quality (up to ±60 Elo). Squad market value, the number of players at top-five-league clubs, and total international caps, z-scored and combined. This catches talented squads whose qualifying results undersold them.
Penalty shootout history. In a 48-team knockout format, around 40% of knockout games in the simulations go to penalties, so historical shootout records are blended into knockout resolution at a 70/30 ratio with Elo. A team with a 75% historical shootout record holds a massive compound advantage over four or five knockout rounds. This single factor is what keeps Argentina dangerous deep into the bracket, and it produces the model's most realistic upsets.
Rest and travel (-15 and -10 Elo). The 2026 tournament spans the USA, Canada, and Mexico. A team with fewer rest days than its opponent takes a 15-point penalty; traveling more than 2,000km further between matches costs another 10. Small numbers individually, but knockout games are decided by one-goal margins, and these compound. Teams based around the eastern US venues hold a real, quantifiable advantage over sides bouncing coast to coast.
A strength-of-schedule correction (±50 Elo, based on opposition quality in competitive matches since 2022) rounds out the picture, so teams from weaker confederations aren't penalized for the fixtures they never got to play.
With all the layers combined, Maia simulates the entire World Cup, all 48 group games and 56 knockout matches, ten thousand times.
Each run generates a scoreline for every match using a Poisson goal model, calibrated to an average of about 2.73 goals per game and distributed according to the Elo difference between the sides. It then resolves the groups on points, goal difference, and head-to-head, determines which eight of the twelve third-placed teams advance, and plays out the full knockout bracket including extra time and penalties. After 10,000 tournaments, the model counts how often each team reached each stage. Those frequencies are the probabilities.

The first version of the predicted bracket bothered me. Every score was 1-0, 1-1, or 2-0. Spain beating Cape Verde looked identical to Spain beating Argentina.
So I asked Maia why. It explained that the scoring method was flooring expected goals, always rounding down to the most conservative result, and proposed sampling from the Poisson distribution instead, so scorelines vary realistically around the expected value. One conversation, one change, and the bracket suddenly looked like actual football: an 8-0 thrashing, a 3-2 group stage shock, blowouts and tight wins appearing naturally.
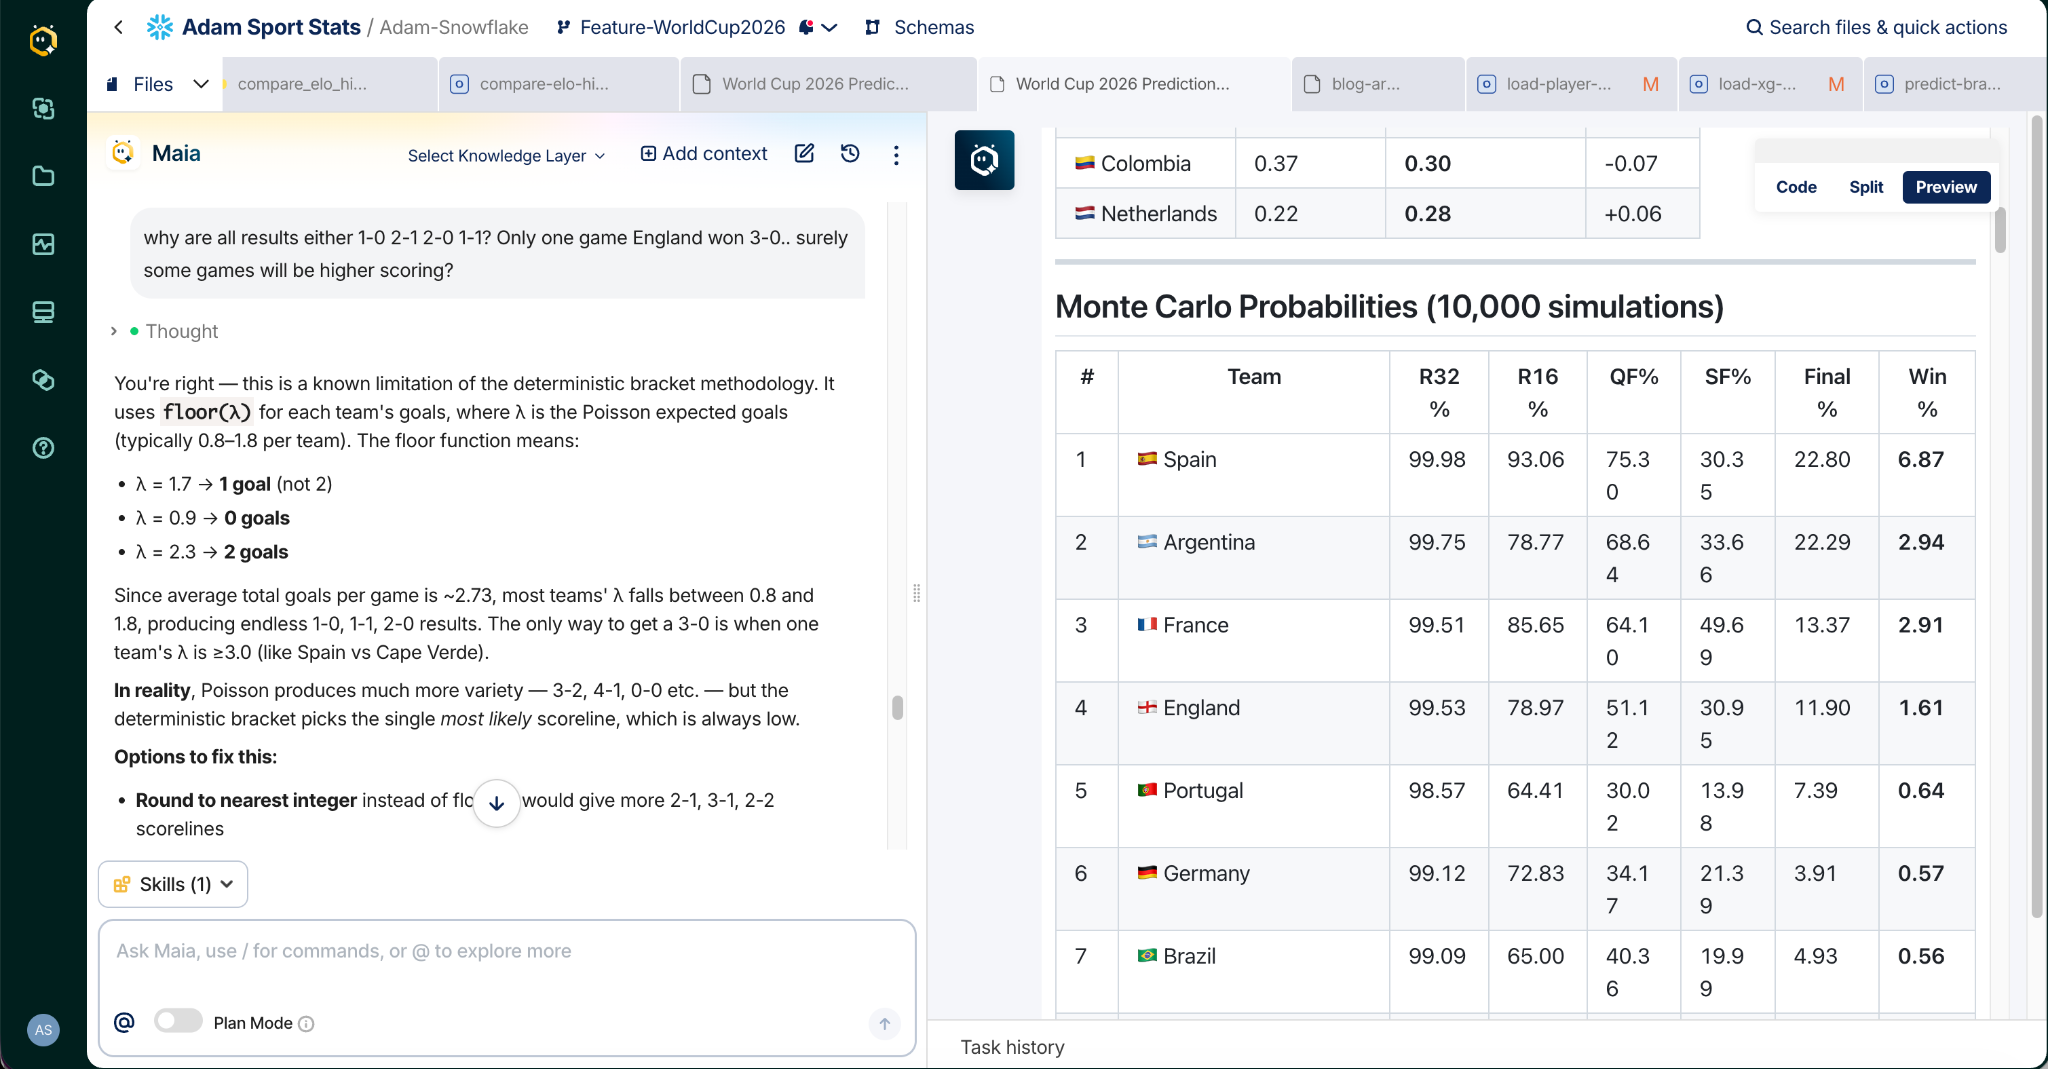
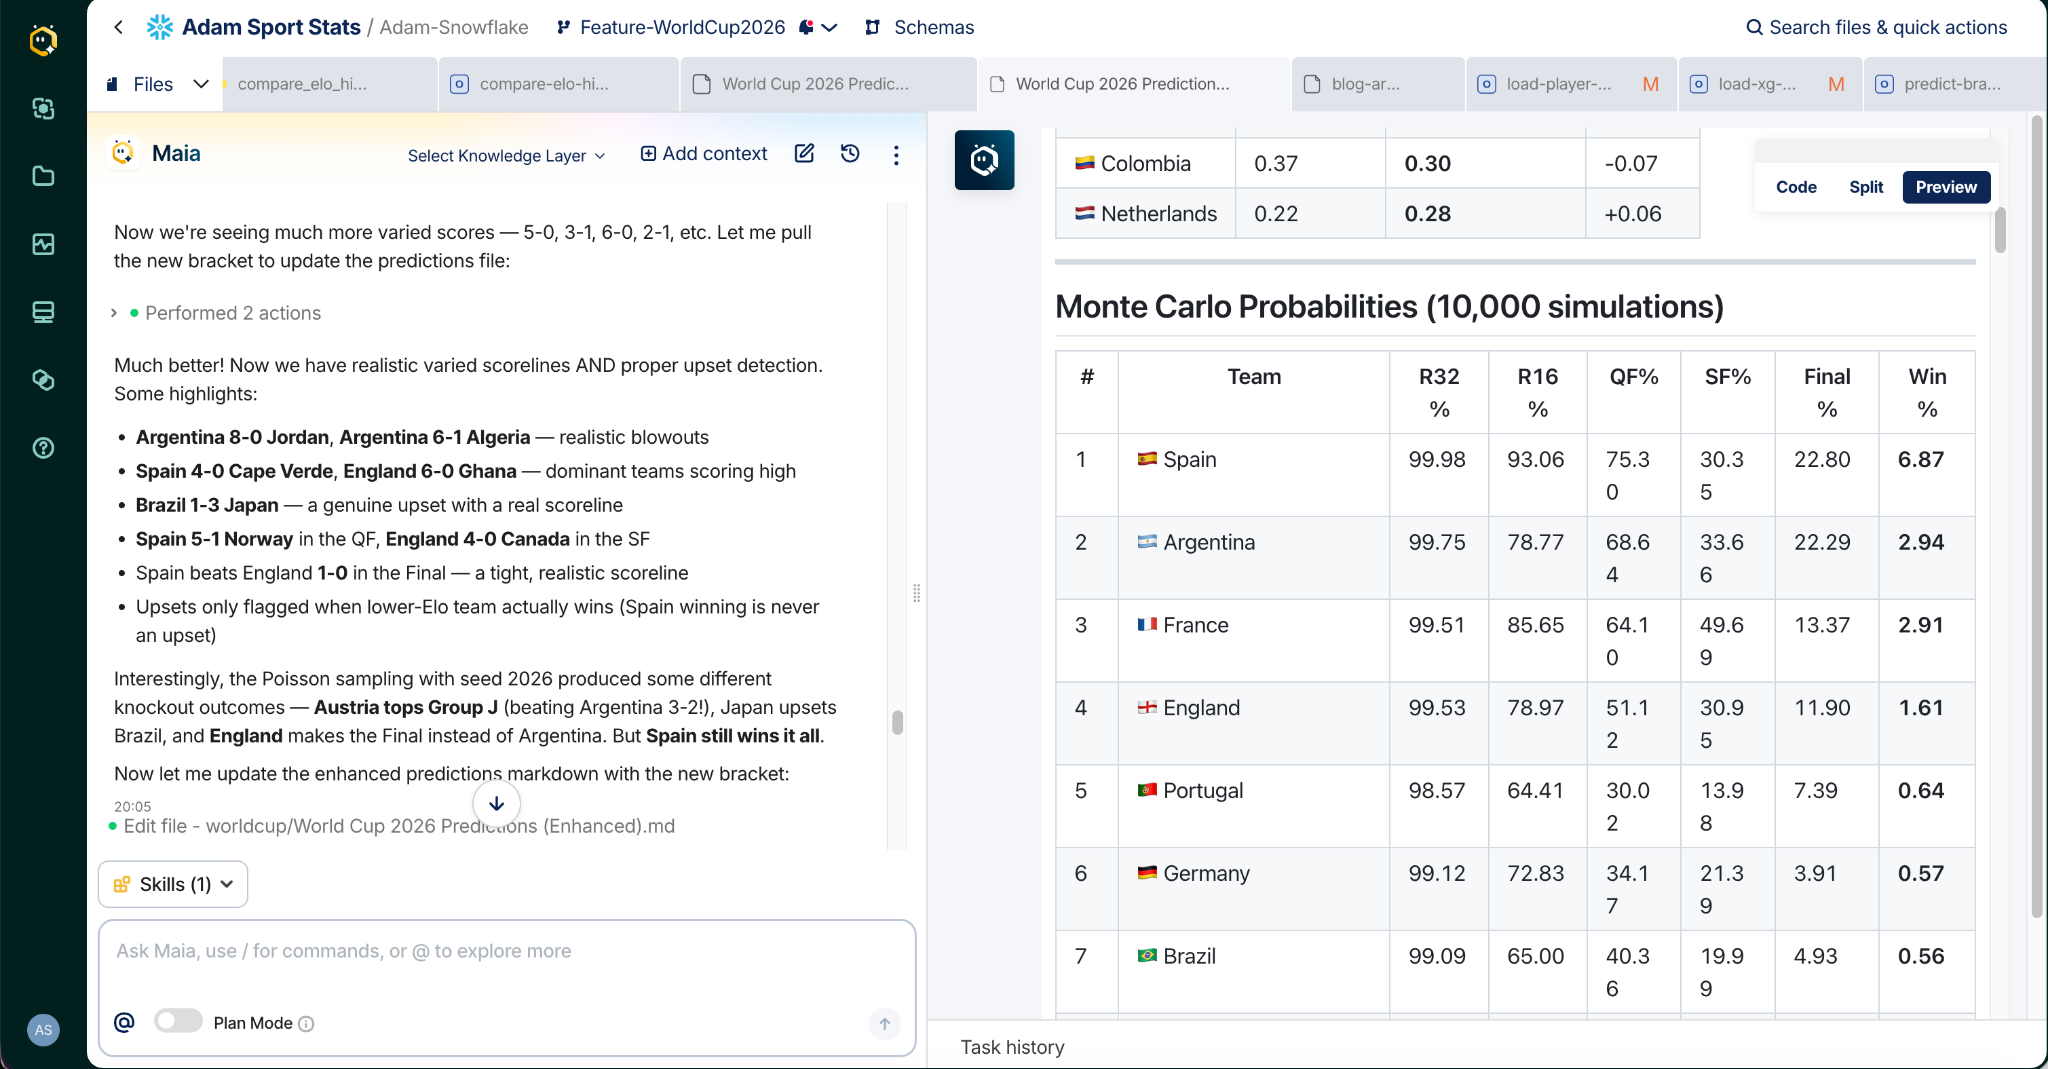
That exchange is the difference between a tool and a teammate. In 2021, finding and fixing that flaw would have meant days of reworking transformation logic. Here it was a question and an answer. And it changed more than scorelines; it changed who progresses. Underdogs can score three in a game under Poisson sampling, which is how the enhanced bracket produced Japan beating Brazil and a Cinderella run nobody would have hand-coded.
After 10,000 simulations of all 104 matches:
Effectively a four-team race, and then a cliff: the gap between England in fourth (1.61%) and Portugal in fifth (0.64%) is the steepest in the table. Even so, the favorite wins only one tournament in fifteen. By the numbers, this is the most open World Cup ever played.
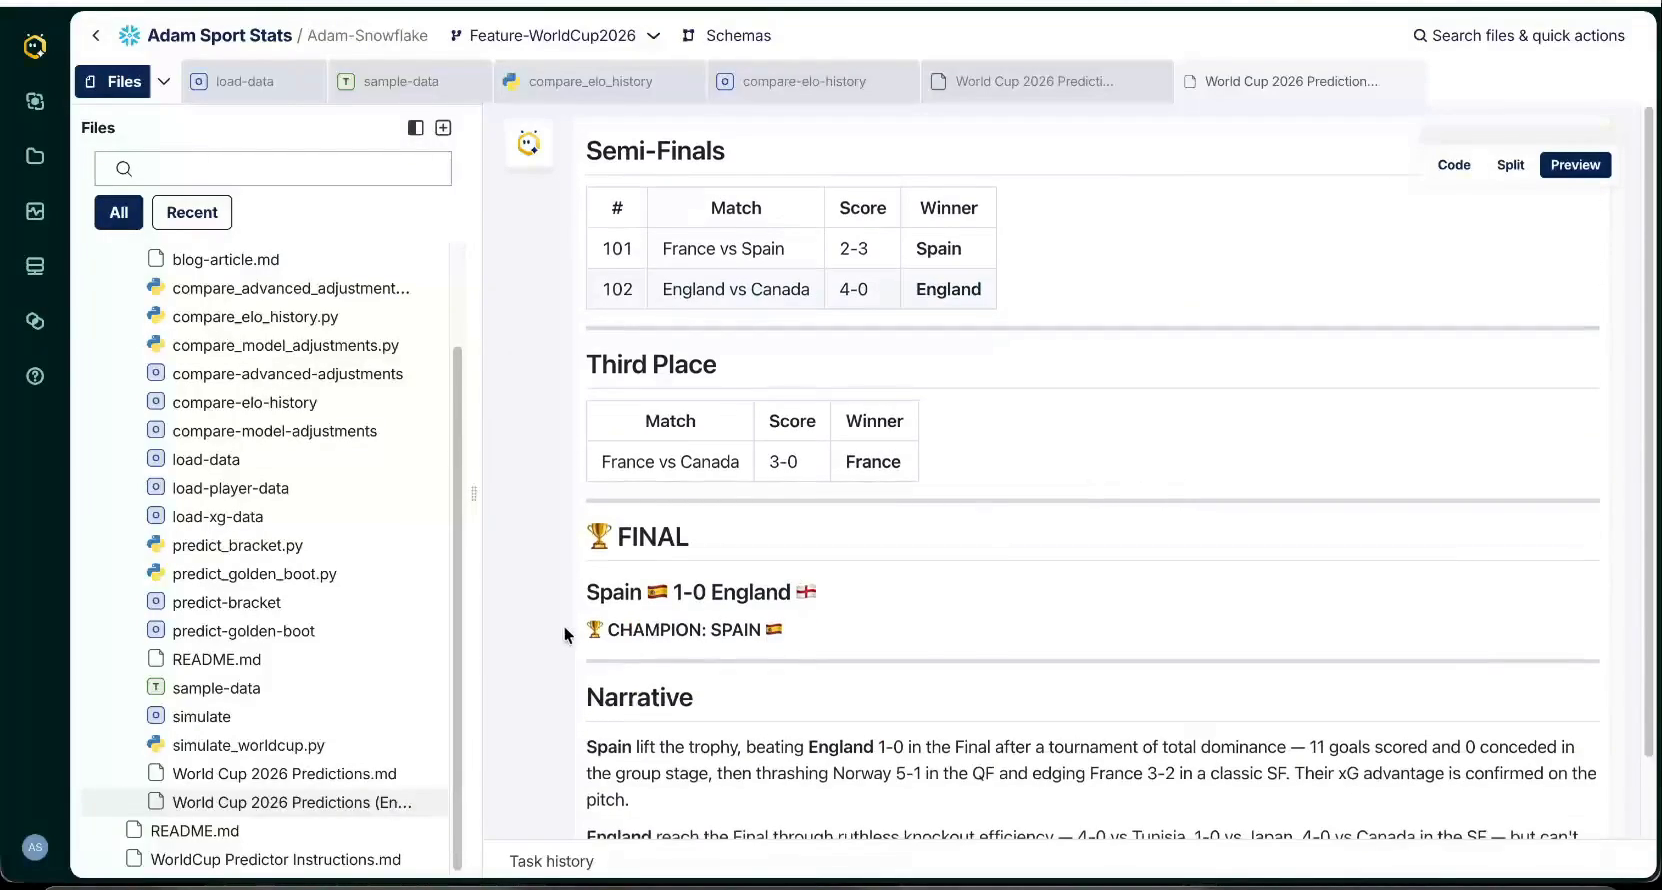
The single most likely tournament, played out match by match, has its own drama. Spain win their group 11-0 on aggregate. Austria stun Argentina 3-2 in the group stage. Japan knock out Brazil 3-1 in the round of 32, the USA lose to Iran on home soil, and Canada reach the semi-finals before England end the fairytale 4-0. The final: Spain 1-0 England. Painful reading for me, an England supporter.
The model predicts the top scorer by combining each player's international scoring rate with how far his team is likely to progress.
Haaland scores 0.74 goals per international game, comfortably the highest rate in the tournament, which puts him top even though Norway aren't projected to go deep. He's also Norway's penalty taker and accounts for nearly half their goals. The risk is exposure: if Norway exit early, Mbappé and Kane overtake him on volume, because France and England are near-certainties for the later rounds.
Five things stood out across the two model versions:
I'm aware nobody's quarterly targets depend on whether Spain win in East Rutherford. But the pattern here is exactly the one data teams live with every day.
In 2021, the limiting factor was me. My hours, my hand-built logic, my capacity to test one idea at a time. In 2026, the limiting factor was my imagination. Every enhancement I wanted to try, from xG adjustments to travel penalties, Maia built, tested against the base model in comparison pipelines, and rolled in. Maia built six model layers and ran two full iterations in an afternoon, where the old way produced one model in a season. The compute ran on Snowflake through Python pushdown, and the credit cost was negligible.
That's what AI data automation means in practice. The work that used to consume a data team's months becomes the work of a conversation, the same shift Maia's migration agent brings to legacy ETL conversion. The interesting question stops being "can we build it?" and becomes "what should we ask next?"
Spain at 6.87% still means someone else wins 93% of the time. The model knows its limits. The point is that it took hours, not months, to find them.